

Kristen
@kkakey_
Followers
95
Following
4K
Media
34
Statuses
1K
data scientist - she/her
New York, USA
Joined June 2016

Linear Regression clearly Explained! Linear Regression models relationship between a dependant variable (y) & two or more independent variables (x1, x2 ...) ❗️For the sake of simplicity we discuss linear regression with a single independent variable. Mathematical
36
564
2K

What is actually worth doing to make a climate difference? According to data. 🚗 ✈️ 🔋 🌱 🔗 https://t.co/kdADyplnkT
#dataviz #ReduceEmissions
1
15
63

Working on a project and want to collaborate together? Hang with us for coffee and code ☕Saturday ☕May 20th☕ 1pm at Marie Blachère Bakery & Café . Details on our MeetUp page:

meetup.com
Come join R-Ladies NY for an afternoon of coding and coffee. This will be an informal, hands-on working session where we'll work together on our own projects or tutorials.
0
1
1
I wrote a short tutorial on how to access data and create maps like mine from Microsoft's Global Building Footprint dataset using #python and #QGIS. The dataset is *really* cool, and this is just a way to get started with it https://t.co/xW4oMoRk9t
4
31
176

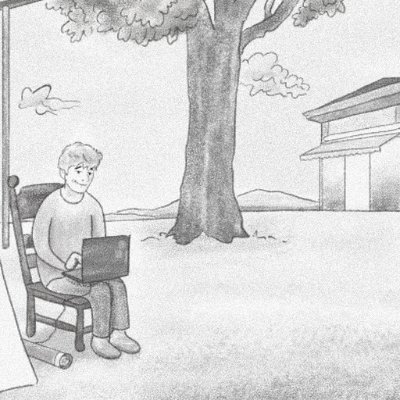
I don’t know who needs to hear this but there is a 30 minute video called “Studio Ghibli Nature Loop” on HBO Max that just plays different pretty scenes from Ghibli movies with ambient sound
327
13K
114K
This month we are reading 👁️🗨️ "Queer Data : Using Gender, Sex and Sexuality Data for Action" by Dr. Kevin Guyan. Come join us for our book club discussion on Saturday 8/20 in Great Hill in Central Park. Details on our Meet Up page.
4
5
10
today is #InternationalCatDay it seems, and there is a Cat Breed dataset on Kaggle for you #Catisticians
https://t.co/njQqtVPnkV

kaggle.com
Images for 67 different cat breeds as labeled by advertisers for adoption
0
1
2

Just discovered you can create a docker image from for your #rstats project with a one-liner using either the DESCRIPTION file or the `renv` lock file:
3
27
156

We're excited to announce Quarto, a new open-source scientific and technical publishing system. Quarto is the next generation of R Markdown and takes what we've learned from the last 10 years and weave it into a more complete, cohesive whole. Read more:

posit.co
Today we're excited to announce Quarto, the next generation of R Markdown.
9
242
924

Blogging is a great opportunity for 📚 learning 🤝 helping others 👨🏽💼 building a portfolio and finding jobs And it has never been so easy to start a blog. To help you, I've created a MASSIVE guide to get you started. Find it at https://t.co/W5qAsSWDhq Highlights in 🧵 #rstats
2
12
63
Get excited for R-Ladies NYC Summer Social next Thursday 7/21 evening at Lucky. 🍹 https://t.co/NlLPZXZhjf 🍹
0
2
4


Putting your work on GitHub probably is the best decision you can make to build your portfolio. But what makes a good project stand out? A good README. Here are 4 ways to make a good README: 🧵
49
577
2K


It was a privilege to present "Level Up Your Labels" at the #rstats @_useRconf poster session this afternoon. Thanks for the good questions! Here's a link to the poster with the full code I used to create the plot. https://t.co/qOBVGnbNRU And here are the 5 tips in detail🧵👇
5
90
435

Not a bar graph - a graph for your bar! 📊🍻 My new #screenprint highlights Wisconsin's favorite drink, the Brandy Old Fashioned Sweet. It's equally great in a supper club or a cornfield. Interactive #dataviz at: https://t.co/rvnAFzV366 Powered by @tableau + @tableaupublic.
7
5
51
Ever heard of logistic regression? Or Poisson regression? Both are generalized linear models (GLMs). They're versatile statistical models. And by now, they've probably been reframed as super hot #MachineLearning. You can brush up on their math with this 🧵. #rstats #Statistics
15
207
1K

I'm super excited to open registration for my new free advanced #tidyverse email course. 🚀Tidyverse booster 🚀: https://t.co/ygCHOTftfP If you sign up, you'll receive weekly emails with tons of Tidyverse tricks starting in July/August 2022. #rstats
4
28
132