William Cai Profile
William Cai

@iamwillcai

Followers
208
Following
167
Media
5
Statuses
103

I think about equity in (algorithmic) decision making. PhD student @stanford @comppolicylab

Joined March 2012
Don't wanna be here? Send us removal request.
@iamwillcai
William Cai
3 years
We hope our work will be of use to practitioners who seek to improve and reform traffic enforcement systems, and support ongoing efforts to improve equity broadly. Full paper: Analysis code:
Tweet card summary image
github.com
Measuring racial and ethnic disparities in traffic enforcement with large-scale telematics data - stanford-policylab/telematics
0
0
4
@iamwillcai
William Cai
3 years
Huge thanks to my co-authors, without whom this project wouldn’t have been possible: @jgaeb1, Justin Kaashoek, Lisa Pinals, @samrmadden, and @5harad.
1
0
3
@iamwillcai
William Cai
3 years
Some of these paths forward may involve experimentation in order to maximize equity of the resulting system while minimizing loss of efficiency (e.g. not deploying officers to areas with no speeding).
1
0
3
@iamwillcai
William Cai
3 years
In light of our findings, we offer a few paths forward for more equitable traffic enforcement:.• Reducing punitive measures (fines) in over enforced areas. • Structural enforcement via speed bumps & roundabouts over stops. • Redeployment to avoid overconcentration of stops.
1
0
3
@iamwillcai
William Cai
3 years
This concentration implies that deciding where to place the relatively small number of speeding traps in each city can have a drastic impact on the demographics of stopped drivers, possibly resulting in the large heterogeneities we observe between cities.
1
3
12
@iamwillcai
William Cai
3 years
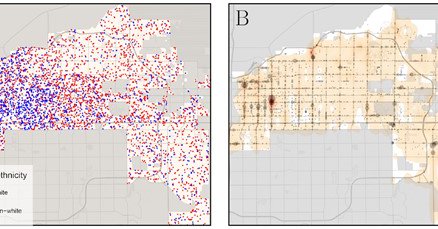
What we found was that a majority of speeding stops are concentrated in relatively few neighborhoods. Specifically, census block groups containing just 10% of the residential population contain between 56% and 76% of the total speeding stops across all ten cities.
Tweet media one
1
3
17
@iamwillcai
William Cai
3 years
Where the parentheticals again compare a beat with 75% non-white residents to one with 25% non-white residents. We wanted to understand why our estimates varied so much from city to city.
1
0
3
@iamwillcai
William Cai
3 years
However, the cities we study look very different from each other. Our measure of disparities in enforcement varies from 2.159 (190% more) in Mesa to -1.183 (45% less) in Houston….
1
0
2
@iamwillcai
William Cai
3 years
The mean of the city-level coefficients is 0.34 (SE: 0.16), meaning our model predicts a beat w/ 75% non-white residents will have roughly 20% speeding stops than one with 25% non-white residents, given the beats are in the same city and have identical driving behavior.
Tweet media one
1
1
6
@iamwillcai
William Cai
3 years
More rigorously, we can run a regression analysis for each city which adjusts for differences in driving behavior between different neighborhoods, and measure how much the number of speeding stops changes in more or less white neighborhoods, net of these factors—.
1
0
2
@iamwillcai
William Cai
3 years
We find that they do not. Here we plot the proportion of non-white residents vs. the proportion of time CMT drivers spent speeding in each police beat across our 10 cities. The weak correlation (r = .04) indicates no link between neighborhood demographics and speeding rates.
Tweet media one
2
1
6
@iamwillcai
William Cai
3 years
For example, we can directly ask questions like: do neighborhoods of differing demographics have different amounts of speeding?.
1
1
3
@iamwillcai
William Cai
3 years
This data gives us a measure of the true rate of speeding in different neighborhoods across those cities, allowing us to separate the effects of enforcement versus offense rates in the context of speeding enforcement.
1
0
1
@iamwillcai
William Cai
3 years
To overcome this challenge, we use a novel telematics dataset from Cambridge Mobile Telematics (CMT), containing anonymized and aggregated vehicular data from hundreds of thousands of individuals across 10 major cities.
1
0
1
@iamwillcai
William Cai
3 years
Previous studies have shown that racial and ethnic minorities are more likely to be pulled over by the police for traffic infractions. However, it’s difficult to disentangle disparities in enforcement from differences in offense rates.
1
0
4
@iamwillcai
William Cai
3 years
Our new paper in PNAS Nexus finds that, while drivers themselves speed as much in white neighborhoods as non-white neighborhoods, speeding enforcement varies a great deal. Paper ( + thread:.w/@jgaeb1, Justin Kaashoek, Lisa Pinals, @samrmadden, and @5harad.
Tweet card summary image
academic.oup.com
Abstract. Past studies have found that racial and ethnic minorities are more likely than White drivers to be pulled over by the police for alleged traffic
1
8
40
@iamwillcai
William Cai
3 years
We hope our work will be of use to practitioners constructing datasets to train models, and broadly support ongoing efforts to make statistical models more equitable.
0
0
1
@iamwillcai
William Cai
3 years
We show that in both settings, our adaptive sampling strategy obtains near-optimal policies, while allowing model-builders to efficiently prioritize traditionally underserved groups and avoid unintended consequences of heuristics such as representative and equal sampling.
1
1
1
@iamwillcai
William Cai
3 years
Polygenic risk scores are a next-generation health tool for risk stratification via genomic data, which have traditionally suffered from poor performance in individuals of African descent due to lack of training data.
1
0
0