
Loki Trades
@iamLokiTrades
Followers
40
Following
12
Media
70
Statuses
75
Full-Time Crypto Trader & Market Analyst 📈 5+ yrs experience | Trading with AI, not luck. Telegram: https://t.co/LvTP7kYjcA
Joined June 2025
#BTCanalysis 1 hour chart:. #Bitcoin appears to be forming another range; bottom 112,250 - 112,500 (LONG attempt) and top 115,500 - 115,750 (SHORT attempt) 👀. This is not the first nor the last time we trade a range, however, we can also trade it in another way, with a higher

0
0
1
#BTCanalysis 4 hours chart:. #Bitcoin has had a lot of #volatility in the last 2 days (something we were looking forward to), where it finally broke the eternal range towards the bottom and then reacted perfectly in our zone posed by the different #confluences we had, however,

0
0
1
#BTCanalysis 4 hours chart:. #Bitcoin finally reached our best #ReactionZone (111,750 - 112,500), raised from a couple of weeks ago, and we are satisfied and happy that our #confluences sum achieves our trades with a great success rate 🚀. How did we know it was a very effective

0
0
3
#BTCanalysis 4 hours chart:. #Bitcoin has finally decided to break the range to the downside after 2 weeks (as we had expected), where it reacted in our LONG zone raised in previous analysis: 113,500 - 114,250 🔥. Clearly we are in a #downtrend on lower charts (1 hour and 4

0
0
4
BTC.D Analysis Daily chart:. Surely you have noticed that altcoins have pulled back since we sent the #BitcoinDominance analysis, where we had commented that there could be a rebound and that would cause altcoins to have their correction 👀. It is important to understand the

0
0
0
#ETH Weekly chart analysis:. Our analysis usually focuses on small time frames, but from time to time it is good to look at a bigger picture, to give us an idea of where we are within the trend (if it has been extended for a long time and if it already touches any pullbacks or

1
0
1

#ETHanalysis 1 hour chart:. #Bitcoin had apparently broken the range in which it was, liquidating positions in Long, where we were able to join in favor of the trend (114,000 - 114,750), reaction zone commented in past analysis and that was a success, however, after the rebound
0
0
1
The most relevant macroeconomic events of the week (July 28 to August 1, 2025):. 1️⃣ Tuesday, July 29: JOLTS job openings, number of job openings during the month, excluding the agricultural sector. 2️⃣ Wednesday, July 30: The Federal Reserve interest rate will be announced,

0
0
1

4-hour #BTC chart analysis:. #Bitcoin has been in #stablecoin mode for the last 12 days, generating more and more #liquidity in this range (leveraged in Long and Short) that seems unlikely to break in either direction. However, we must not forget our reaction zones where we have

0
0
3


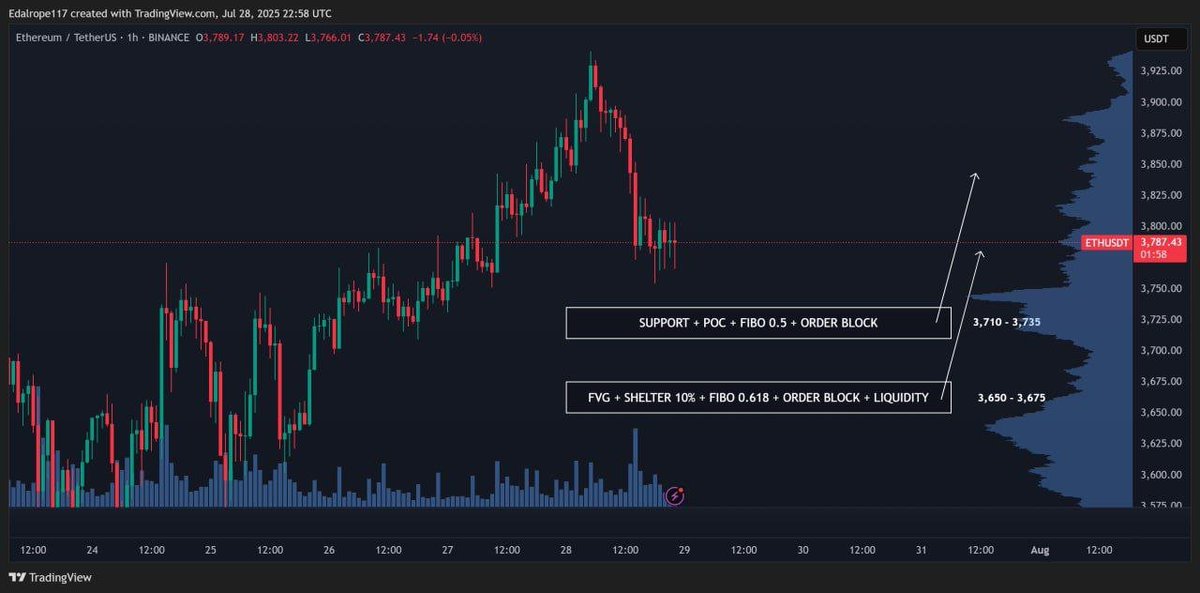
#ETHanalysis 1 hour chart:. Before talking about #ETH, I want to highlight that #BTC has not changed structure, we are still in range and our reaction zone for SHORT (see previous analysis) 💪🏻 was respected. On the other hand, we had already anticipated a strong move in
1
0
3
#BTCanalysis 4 hours chart:. Since #Bitcoin touched 123,000 #USD, the projection we had from 4 days ago is "range" or fall", and it seems to be sideways (that to a large extent has helped $altcoins go up). Simple formula:. #Bitcoin sideways + BTC.D (Dominance) falling = #Altcoins

0
0
2


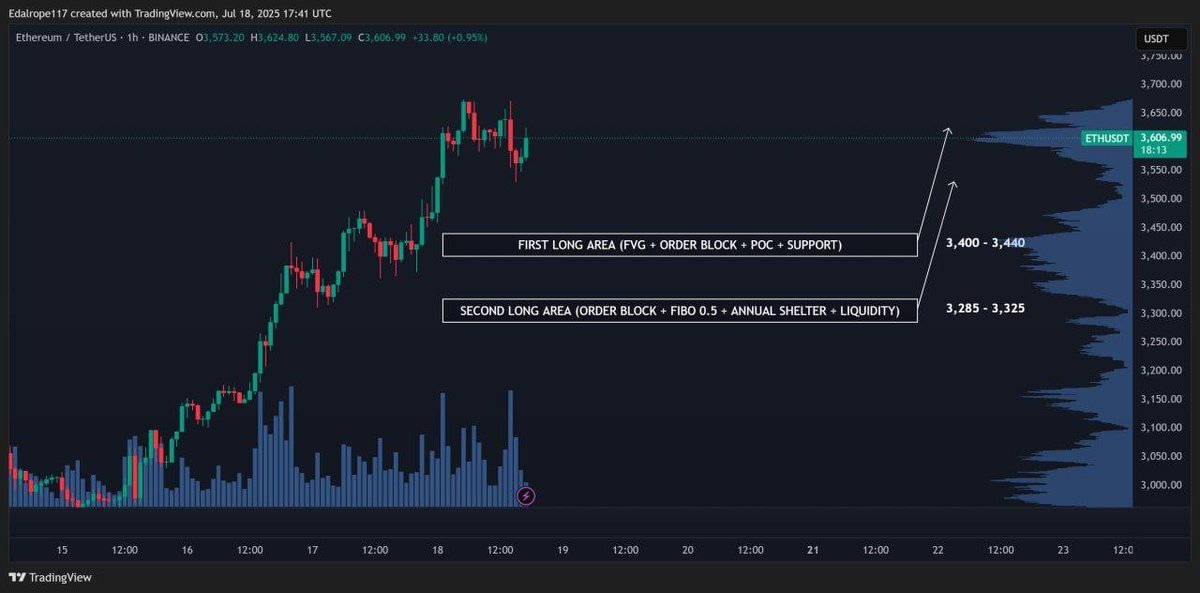
#Ethereum is at its Longs Party as we saw on live, the next important level is the #OrderBlock Graphed Display, that level between $3,300 and $3,400 📈. #Ethereum #ETH #LongsParty #OrderBlock #CryptoTrading #ETHUSD #Breakout

0
0
0