Explore tweets tagged as #visualizations


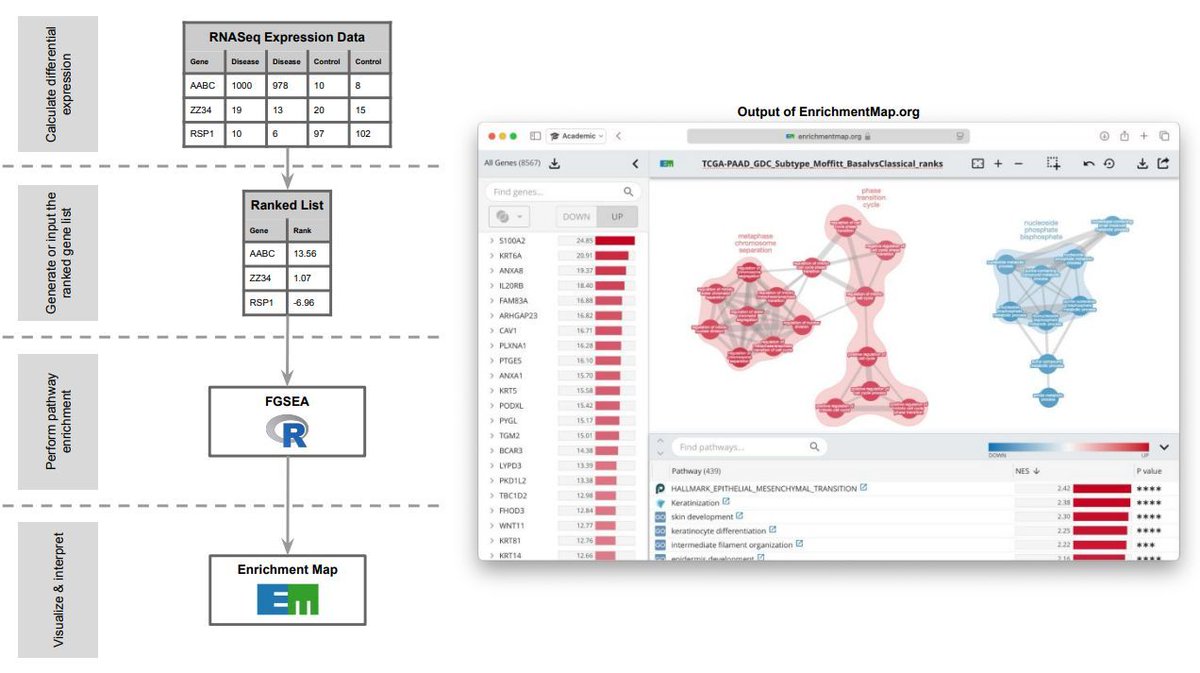
Gene-Set Enrichment Analysis and visualization on the web using EnrichmentMap: RNASeq. #GeneSetEnrichmentAnalysis #WebTool #Bioinformatics @BioinfoAdv.
1
51
185

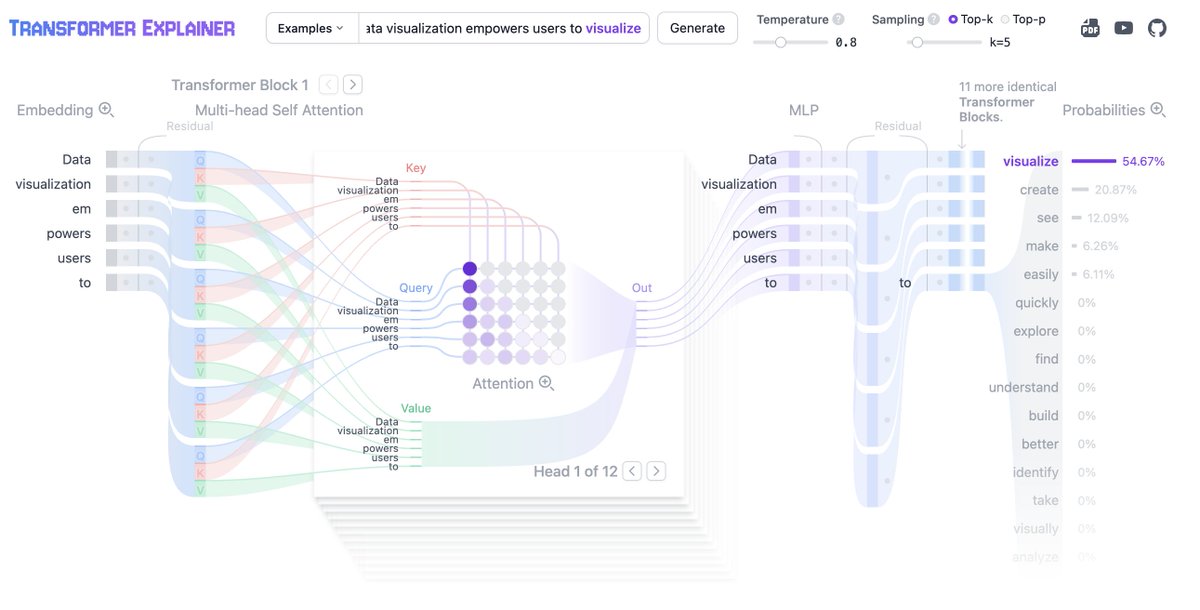
Impressive visualization of the Transformer architecture. When will people be able to vibe-code this kind of stuff?!
6
27
218

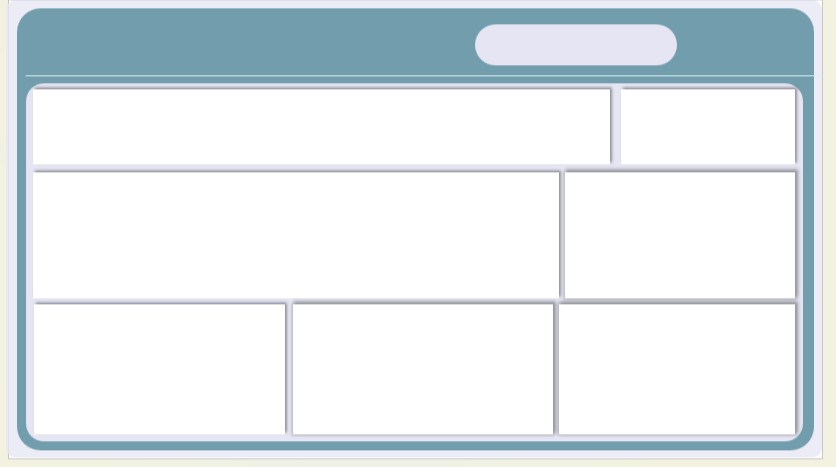
Wireframing before visualization has been a game charger, and I don't use a fancy tool for it, just PowerPoint! Planning my layout first makes the process smoother, faster, and less frustrating compared to the struggle with layout and backgrounds when.

10
12
124

Admire: Mandelbrot and Julia sets [2].(from Dimensions: A Walk through Mathematics).#math #science #iteachmath #mtbos #visualization #elearning #geometry
0
2
9

FREE Google Drive link to learn:. -Data Analytics.-Business Analysis.-Data Visualization.-SQL .-Big Data.-Resume tips.-Project Mgt.-Product Mgt.-Software Eng.-UI/UX Design.-Interview tips and tricks. Check this Google drive link: Share this! Someone on
3
138
645

Sometimes it's helpful to visualize your network traffic in real-time. So here, @chairahalkar helps you build a network traffic dashboard with Python and Streamlit. You'll learn how to capture raw network packets from the NIC, process the data, and create visualizations that

6
67
491

PAST example of how tsunami waves can travel: visualization of the Fukushima earthquake (M 9.1) off the coast of Japan in March 2011.
3
41
195


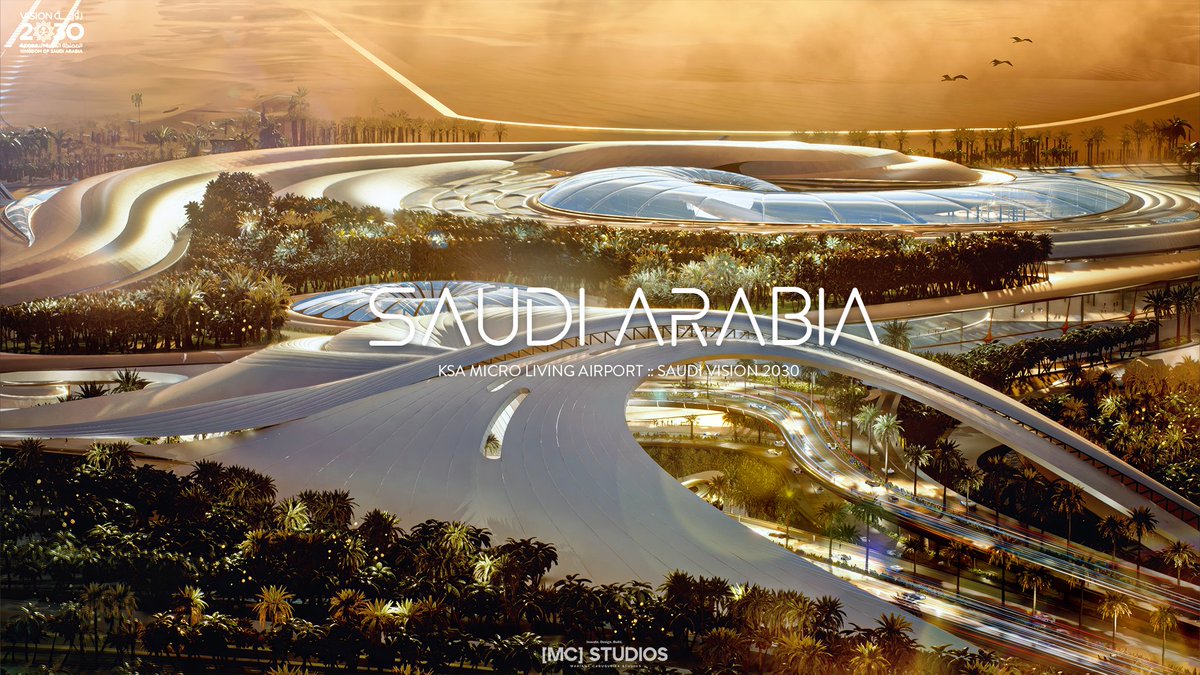
KSA MicroLiving Airport: The World Smartest airport.Read more: Tools used: Autodesk Maya,Unreal Engine gameplay,Unreal Engine Live Rendering,Meta Human Creator, Reality Capture,Substance Painter,Rhinoceros 3D,Grasshopper,Midjourney AI,Kling AI,Luma AI.


0
2
10

Free Data Visualization 101 Course! #BigData #Analytics #DataScience #AI #MachineLearning #IoT #IIoT #Python #RStats #TensorFlow #Java #JavaScript #ReactJS #GoLang #CloudComputing #Serverless #DataScientist #Linux #Programming #Coding #100DaysofCode .

0
6
62
PhyloScape: interactive and scalable visualization platform for phylogenetic trees. r#PhylogeneticTees #Visualization #Bioinformatics #BMCbioinformatics.

0
27
88


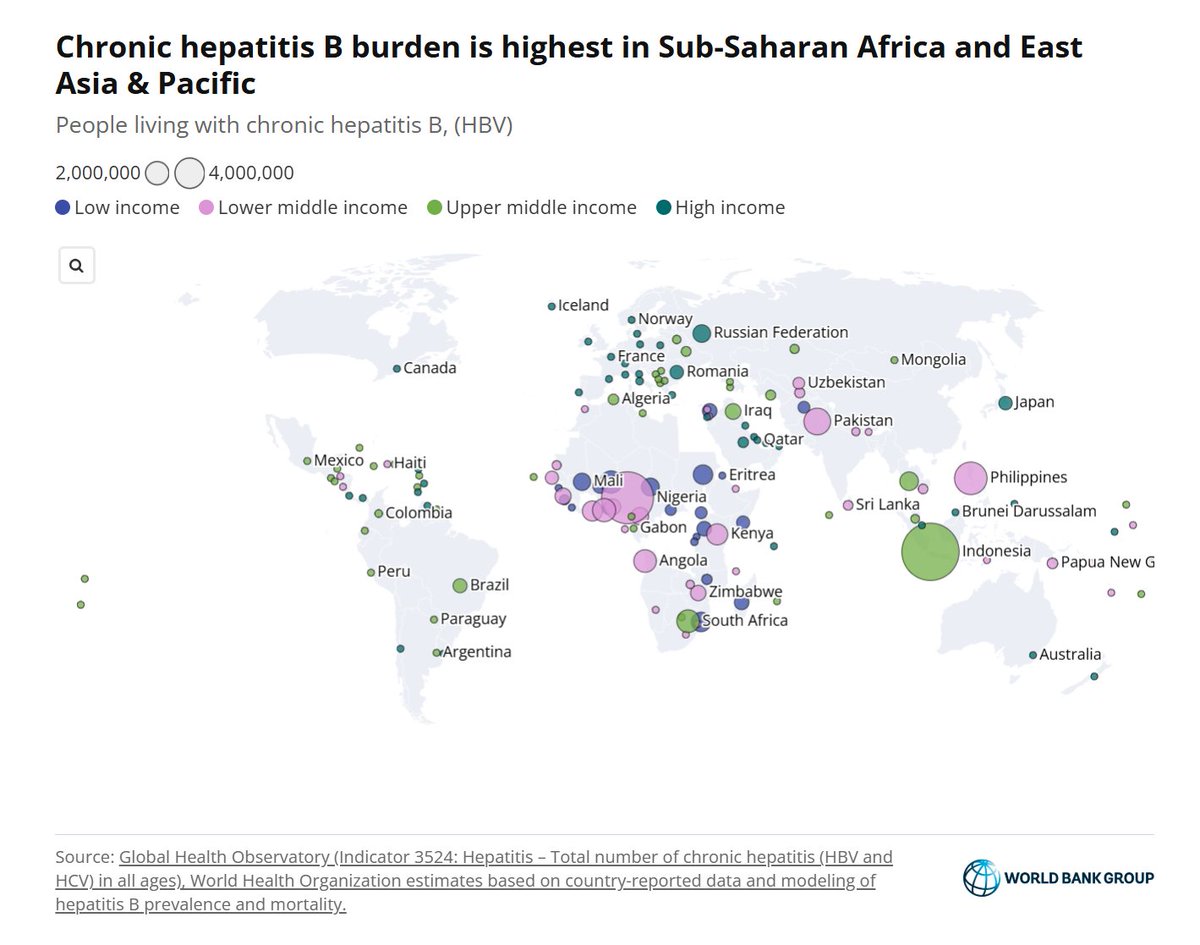
254 million people live with chronic #hepatitis B, but most don’t know it. New #data show progress in childhood immunization—but coverage is slipping in key regions. Read more and browse the data visualizations:
0
1
2

The Power of Data Visualization in Business Decision-Making 📊. In a world overflowing with data, it's not enough to collect numbers—you need to make them speak. That’s where data visualization comes in. It’s more than charts and graphs —. #DataAnalytics #DataVisualization

1
0
10

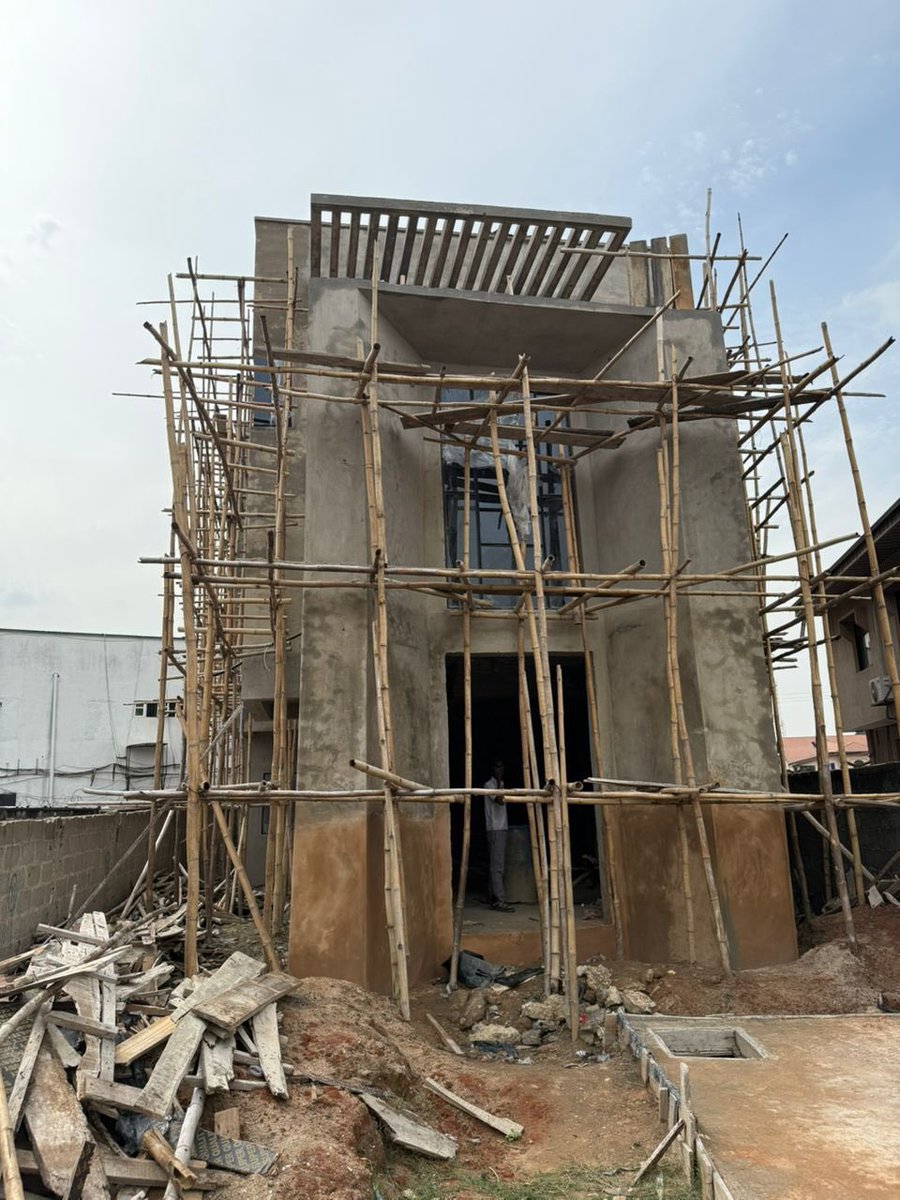
𝐊ø𝐤𝐤𝐞𝐧 (𝐃𝐚𝐧𝐢𝐬𝐡 𝐟𝐨𝐫 "𝐤𝐢𝐭𝐜𝐡𝐞𝐧").-----------------.A clean blend of natural wood, stone textures, and soft lighting capturing the essence of modern Scandinavian design - warm, minimal, and thoughtfully functional. --------.Design & Visualization: @Femi_Femibliz


4
11
52

If you’re interested in LEARNING all of these for FREE:. 📝Product management.📝Project management.📝Business analytics.📝Data visualization.📝Microsoft excel.📝Data analytics.📝Big data.📝Scrum.📝UI/UX.📝Agile.📝SQL. To get just:. 1. Like & Retweet.2. Comment "SEND".3. Follow

51
24
61

Join us live in 15 minutes for a discussion about accessibility with Piccia and Michelle. This week's topic is Color & Contrast. Future topics: Layout, Legislation, Captions, Social Posts, Data Visualization, Animations. @piccia @michelleames #A11y

0
2
2

🚨 We’re looking for data viz experts! 🚨.We're seeking participants for a study on visualization design diversity 🎨📊.Interested in participating? Sign up here and we’ll follow up with more details!.👉#dataviz #HCI #UXResearch #ParticipantRecruitment.
0
3
3