Explore tweets tagged as #googlechartsapi

チャートの陽線陰性区別つかない問題修正.python + flask + GoogleChartsAPIで株価チャート. あとは移動平均線やボリンジャーバンド追加かな。

0
0
0
代休でちょろっと俺的チャートツールのモック作成始めてみた。とりいそぎ、webでローソク足と出来高をグラフ描写するところから。. 使ってるのはGoogleChartsAPI。少し触って慣れてきたから、処理に計算式入れて移動平均線やボリンジャーバンド、RSIとか描けそう

0
0
0


0
2
2

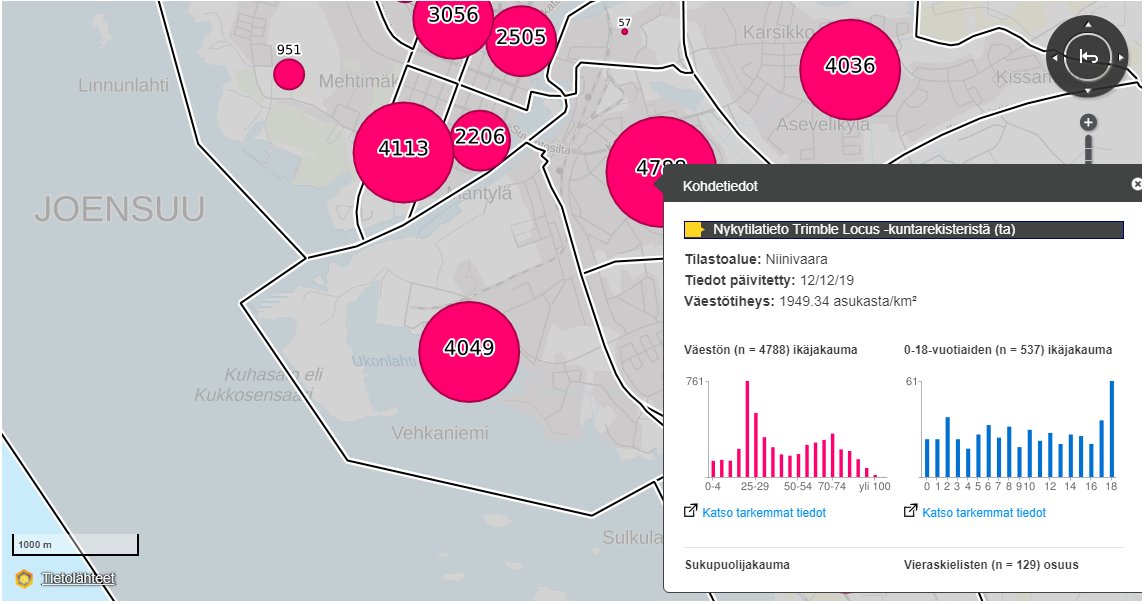
New Blog post: @jarnokin a.k.a the GIS-MAN tells us how he uses Oskari as a tool for managing with information #Googlechartsapi #Oskaricommunity #FOSS4G
0
1
6


Python思ったとおり動いてくれるし、コードも短くて済むしすげー楽。.ローソク足描くとこはGoogleChartsAPI的に仕方なくJavaScript使うけど、それ以外は全部Pythonで書くわ.
0
0
1

GoogleChartsAPI を使ってりんくの hover で QR こーどを表示してくれる jQuery ぷらぐいんかぁ・・・ でざいんがこわくて普段は使わないようにしてるけどにう(・【みかん http://bit.ly/e5ZeRi.
0
0
0

Será que com esse hype de geradores de gráficos vai sobrar uma solução aproveitável? GoogleChartsAPI, jQuery+Flot, Plotr, OpenSWFCharts. .
0
0
0

"Using Google Charts API to Visualize Schema Changes" http://t.co/Q1NDUIzZNB
#sqlserver #GoogleChartsAPI #dba.
0
0
0


Read #TeamSCS blog. Learn to beautify apps w/o a lot of detailed, time consuming software dev. >> #GoogleChartsAPI.
0
0
0

いまのプロダクト、GoogleMapsAPI使ってるしグラフとか特殊アイコンとかはGoogleChartsAPI使う予定なので不用意にAPIがバージョンアップされると死ぬ。.
0
0
0
0
0
0

I really hope there will be *good* internet access tomorrow. My project depends on it to generate the charts! #googlechartsapi.
0
0
0
Want a quick solution for integrating a bar graph into your #MVC app? Try #GoogleChartsAPI. Read #TeamSCS blog >>
0
0
0

Nice ^SS >RT @sharejPoint: New GoogleChartsAPI #jPoint and #jQuery webpart to easily chart #SharePoint list data. http://bit.ly/jPoint.
0
0
0

http://t.co/agmcvH2acn この下のグラフみたいな感じですか?データはあるのでそれをGooglechartsAPIで表現する感じでやってます。ご意見めっちゃ宜しくお願いします!@YusukeShinozawa.
1
0
0
New GoogleChartsAPI #jPart is #jPoint and #jQuery client side webpart used to easily chart #SharePoint list data. http://bit.ly/jPoint ^SS.
0
0
0