Explore tweets tagged as #fibonacci


the fibonacci sequence and golden ratio often appear in nature, art, and design: admired for their sense of proportion and harmony
12
196
895

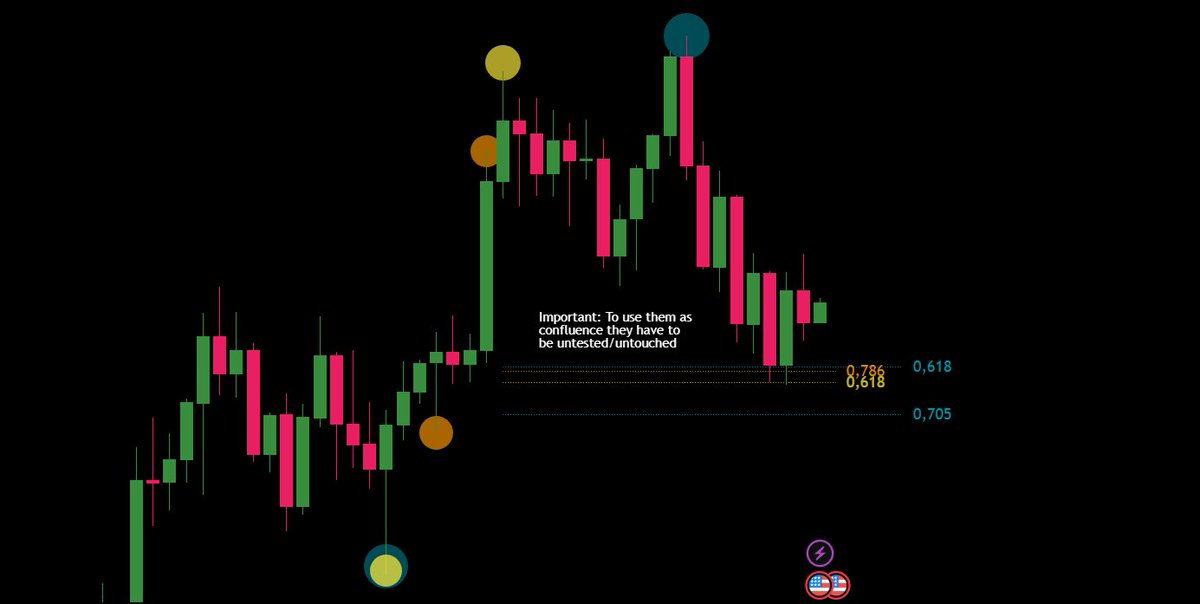
🧵Full @Moneytaur_ Fibonacci Guide. The most important Fibs:.Retracements: 0.5 (EQ), 0.618 (GP), 0.705, 0.786.Neg. Fibs: -0.5, -0.618, (-0.786, -1, -1.5, -1.618 etc.).Extensions: 1.618. How to draw Fibs? . Retracements:.Downtrend: SH to SL.Uptrend: SL to SH. Using the wicks not


5
17
115


🚨 $BTC Update . 📈Weekly candle bounced perfectly off the Fibonacci golden ratio (0.618) . 🔥 Holding strong at trendline support — this setup looks super bullish! . 👀 Now all eyes on $118,369 –– This level is acting as a key resistance and once broken. 🚀 We’re likely heading

43
68
329

$IWM Weekly Chart Update. That third consecutive close above the 0.886 log Fibonacci level screams risk on, regardless of all the other narratives that are floating around.

4
1
9


$TSLA RARE Fibonacci Harmonics!. Double INSIDE MONTH Breakout CONFIRMED Low RISK HIGH REWARD SETUP -> I Started WITH SHARES and WILL ADD LEAPS!. I will keep you alerted here on X NO CHARGE just drop a heart for me this has huge potential!

30
20
205
$RIOT Weekly Chart Update. Indecisive candle, but as long as it's holding the Tenkan (blue line) as support, everything is very fine, and the 0.5 log Fibonacci level remains the next target.

1
0
4

$DOGE breaking out, flipping risk on….


2
1
3
$CLSK Weekly Chart Update. Downtrend on decreasing volume informs of seller exhaustion, but to really call a bottom, it needs to reclaim the Bull Market Support Band. A touch of the 0.5 log Fibonacci level could be possible, and it's crucial to hold that as support.

1
1
9

$BTC usually bottoms at 0.382 Fibonacci level. This happened in Q3 2024, Q2 2025 and will probably happen again. For anyone wondering how low we can go, 0.382 Fibonacci level is currently around $100K. So the worst case scenario is a 10% drop before a 50% rally above $150,000.

184
106
243


XAGUSD extended its rally within the ascending channel, with higher swings and a widening gap between bullish EMAs reinforcing its upward momentum. If XAGUSD breaks above the 127.2% Fibonacci Extension at 41.50, the price could approach the 161.8% Fibonacci Extension at 43.00.

6
2
22
$WGMI Weekly Chart Update. Has some trouble at previous ATHs, and the upper Bollinger band resistance doesn't make things easier. Overall, very bullish chart due to the 0.886 log Fibonacci level break + backtest and recent continuation from there.

1
0
5


$pepe update ‼️ . 📊 PEPE/USDT Daily Harmonic Outlook.•Current structure is showing a Bearish Harmonic Pattern (Gartley/Alt Bat variation) with key Fibonacci confluences lining up. •Price is consolidating under the moving averages after rejecting the C–D leg. 🔑 Levels to

1
2
2
$TSLA Weekly Chart Update. Breaking out of the Ichimoku cloud is a significant development. It still has yet to break above the 0.886 log Fibonacci level, which is the final boss resistance before new ATHs are possible.

2
1
6

This alone will separate yourself from the masses. Here is your cycle with fibonacci retracement levels and extensions. We also gave you the underlying emotions that are playing out in each wave. Bookmark and always be able to reference. Always ask yourself before you begin a

5
10
33