Explore tweets tagged as #SWDchallenge

📊 #SWDchallenge JUN 2025 | transform a graph. From 17x overspend to $1.3M savings 💰.🚨 $47M overspend vs industry. 📈Quadrant supplier analysis. ✅Strategic sourcing solution. 🔗:. #SWDchallenge | #dataviz | #rstats | #ggplot2

1
1
10

Don't simply show data—tell a story with it! In the June #SWDchallenge, I provide the starting point: a real-world sub-stellar slide. Pick a single visual to redesign, clarifying a key takeaway, or revamp it all into a data-driven story. Share by 6/30:

2
12
37

#TidyTuesday📊#SWDchallenge – DEC 2024 | Tell me something good!. Data from the ILO for Africa's lower-middle-income region shows progress in reducing working poverty rates by gender and age group. 🔗: #SWDchallenge | #dataviz | #rstats | #ggplot2

0
5
29
Update (October 11, 2024): This post has been updated based on valuable feedback from the #SWDchallenge community.

0
0
0


📊#SWDchallenge – JAN 2025 | visualize qualitative data. Analyzing emotions in "One Hundred Years of Solitude" reviews. Exploring how 42 readers experienced García Márquez's masterpiece. 🔗: #SWDchallenge | #dataviz | #rstats | #ggplot2

2
11
49
📊 #SWDchallenge – MAR 2025 | resist the temptation to show all the data. 🔗:. #SWDchallenge | #dataviz | #rstats | #ggplot2

1
3
20

#SWDChallenge for March. Florence Nightingale's Rose Chart revised to include Army size for a better understanding of mortalities in the original chart. #datastorytelling #dataviz #florencenightingale #infoviz #rosechart #storytellingwithdata


2
0
0


📊 #SWDchallenge Mar 2025 | present disappointing results.Visualizing policy failure: OECD data shows youth vaping rates surged 190% despite regulatory interventions. 🔗:. #SWDchallenge | #dataviz | #rstats | #ggplot2

1
5
39
Here is my #viz for the #SWDchallenge | Exercise - make the point clear. 📂: #SWDchallenge | #dataviz | #rstats | #ggplot2


1
1
9
️️ ㅤ . [#AN_TikTok]. 𝗮𝗻𝗵𝘆𝗽𝗲𝗻 just posted a video. Selamat pagi, selamat hari jumat. Ayo senam bersama ANHYPEN! 🤩. ️️ ㅤ .🎵 Pikiranku lepas SWDChallenge. ️️ ㅤ
0
53
0

Here is my #viz for the #SWDchallenge– SEP 2024 | stack it up!. The data for this month's challenge comes from a worldwide database of hydrogen projects (via the International Energy Agency). 📂: #rstats | #SWDchallenge | #dataviz | #ggplot2

0
2
43

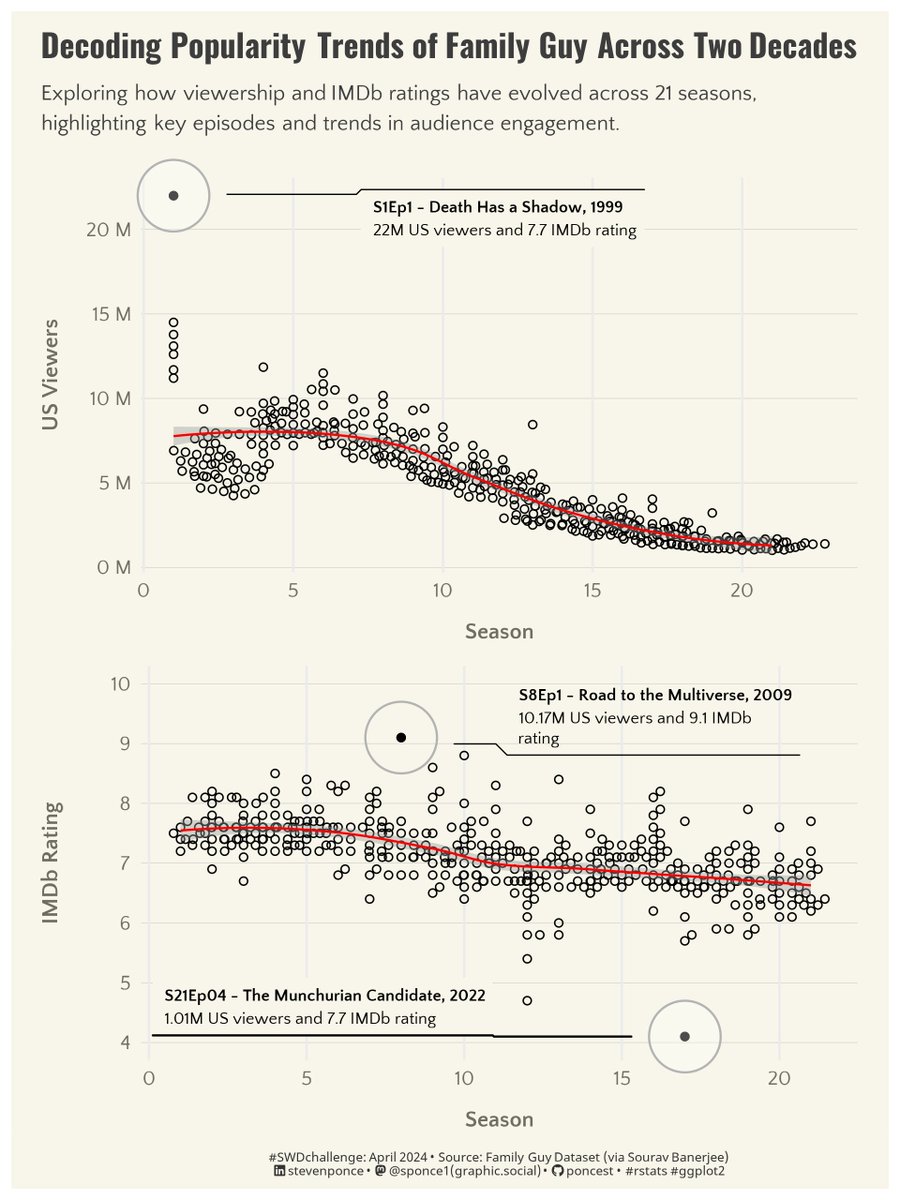
Here is my #viz for the #SWDchallenge– MAY 2024 | when every point matters. The data comes from Kaggle via Sourav Banerjee. This #viz is about Family Guy, an animated sitcom, seasons 1 – 21. 📂: #SWDchallange | #dataviz | #rstats | #ggplot2
1
3
27

#SWDchallenge Remake a famous historical graph - Minard's Russian Campaign of 1812, made with #Tableau. 🔗 I had come across this graph a few times, but had no idea how much detail it has, fascinating story! . #swdcommunity @storywithdata


3
3
40
Here is my #viz for the #SWDchallenge– JUN 2024 | make a funnel chart. The data presented here was synthetically generated using ChatGPT 4 for illustrative purposes only. 📂: #SWDchallange | #dataviz | #rstats | #ggplot2

1
1
9