Explore tweets tagged as #GraphicalMethods
‘Beyond differences in means: robust graphical methods to compare two groups in neuroscience.’: an article on #ScienceOpen. #datavisualisation #differenceasymmetryfunction #quantileestimation #robuststatistics #shiftfunction #neuroscience #graphicalmethods
0
2
3
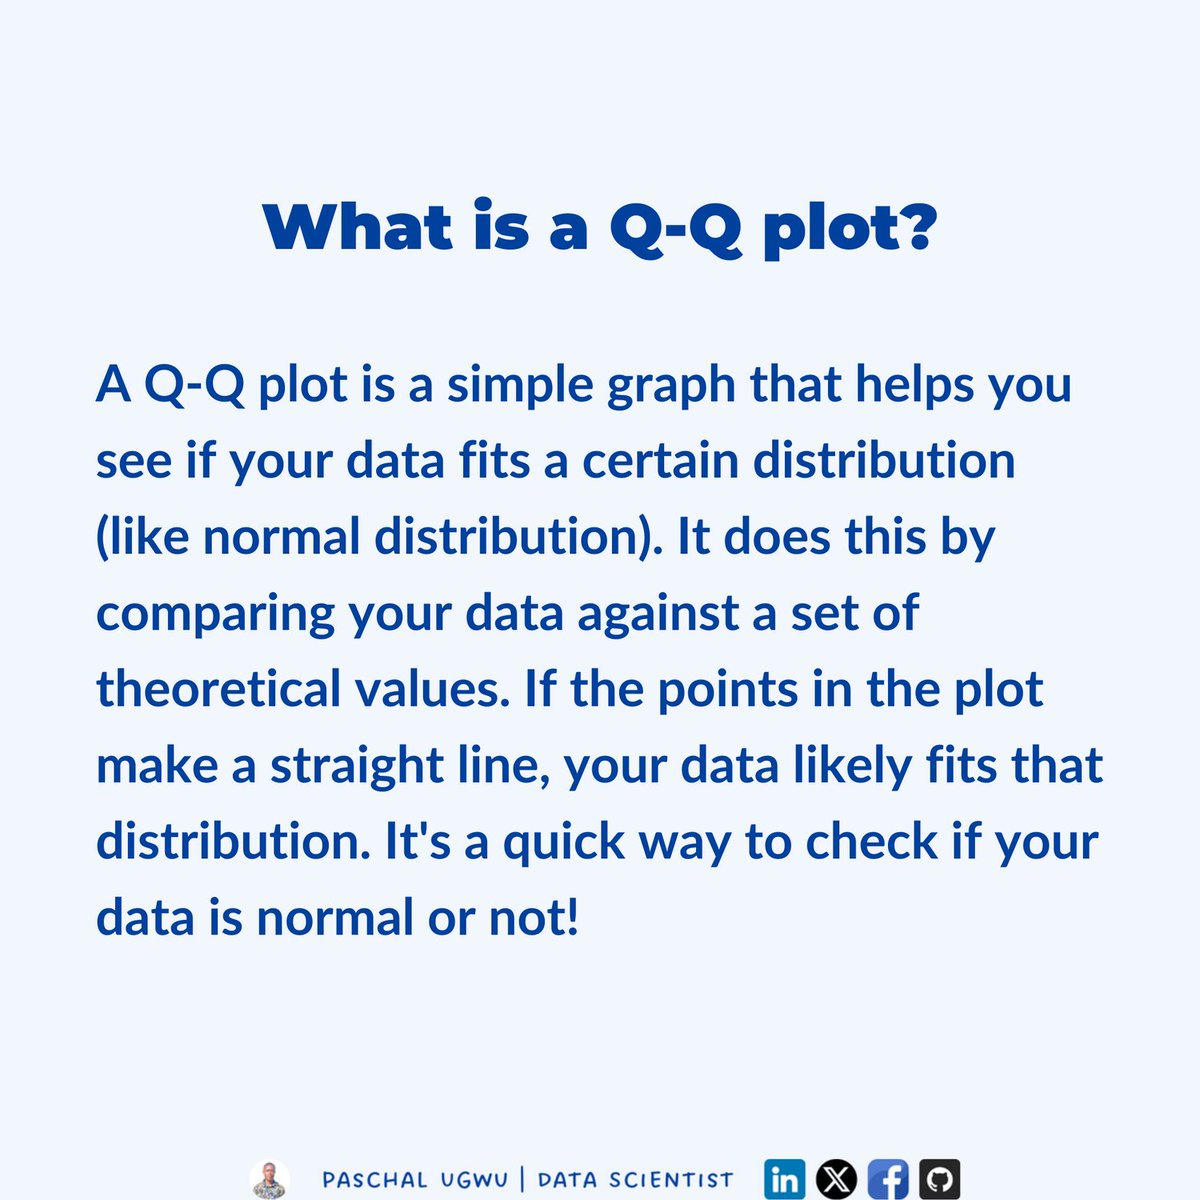
A Q-Q plot visually assesses whether your data conforms to a specific distribution by comparing it against theoretical values, where a straight line indicates conformity. #QQPlot #DataAnalysis #NormalDistribution #StatisticalTools #DataScience #Analytics #GraphicalMethods
0
0
1
Business Statistics - Data Distribution (Skewness) .#skewness #asymmetry #datadistribution #businessstatistics #datasetshape #symmetric #testforskewness #graphicalmethods #statisticaltests #fivepointsummary #interquartilerange #median #datashape.
0
1
1
my ghad. exam nanaman bukas hope na hindi mabagsak. goodluck to me and to my classmates. #Linearequations.#GraphicalMethods.
0
0
0


