Explore tweets tagged as #GraphVisualization

🚀 What if you could see the connections in your local documents? explains how graph visualization works and why it's a game-changer for productivity. #graphvisualization #dataviz #localdocs
0
0
0

Heatmaps are now available in Data Explorer for @neo4j v2! Use color-coded maps to visualize patterns in your graph and gain new insights. Analyze your data with ease and try it free: . #Neo4j #DataExplorer #GraphVisualization #DataScience
0
2
6

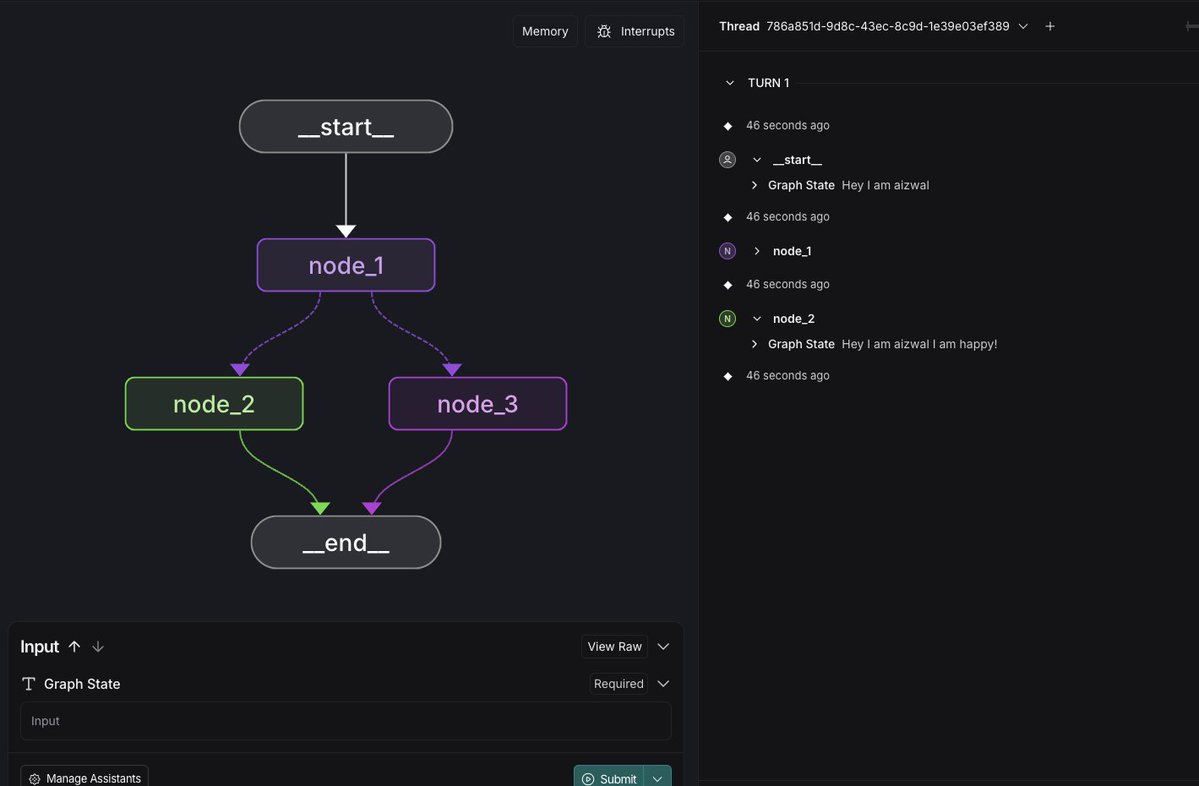
Just learned about LangGraph & it's mind-blowing! 🤩 This graph visualization is awesome. Seriously impressed. #LangGraph #AI #GraphVisualization #NLP
0
0
0

See our new Tom Sawyer Perspectives 13.2. We've spent the last two years improving our nested hierarchical layout. We've been able to reduce crossings by approximately 30% on average and sometimes the improvements are up to 50%. #graphvisualization #graphtechnology
0
0
1

Let's explore the benefits of using #graphvisualization to analyze and understand local documents. Learn how this approach can improve #productivity, knowledge management, and decision-making. #datavisualization #graphrag

0
0
0

Revolutionize Your Data Analysis with Excel's Built-In Copilot?.#ExcelCopilot #DataAnalysis #GraphVisualization #SmartInsights #ExcelFunctions #EfficientExcel #TimeSaver #ExcelTricks #DataCrunching #ExcelTips. Full video:
1
0
1

Curious about the structure of your #data? Use Perspectives to uncover connections, extract key details, and reveal metadata effortlessly. Insights are just a click away! #dataops #graphvisualization #graphtechnology

0
0
2
We just released #yFiles for #HTML 2.6, packed with amazing features and enhancements. Check out the release notes here: . #yFiles #webdevelopment #graphvisualization

0
0
4
Our latest blog post is about Vue Graph Visualization! Learn how to build high-performance, interactive graph visualizations in Vue.js using top libraries like Chart.js, D3, ECharts, Vis.js, and more. 📈. #vue #javascript #graphvisualization #graphtech.
0
1
2
Don't miss out on our webinar series 'The Art of Graph Visualization'! Explore how graphs power our everyday lives, from finance to tech, and learn how #GraphVisualization enables you to understand complex data and create intuitive visual representations.

0
0
4

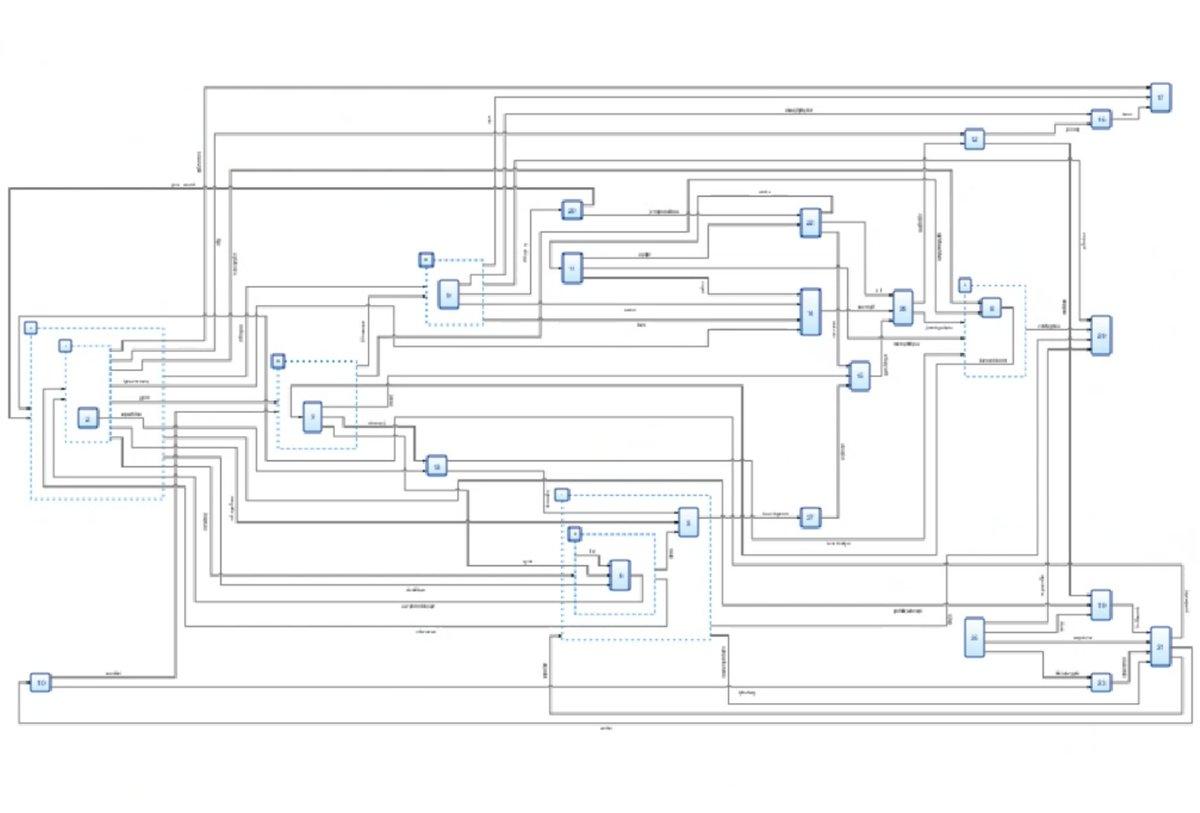
Model Explorer: Graph visualization for large model development. #LargeLanguageModel #GraphVisualization #Development #Software #Technology #ModelExplorer #HierarchicalFormat

0
0
0
Don't miss out on the upcoming episode of our 'The Art of #GraphVisualization' #webinar series!.Join us on Feb 28 at 5pm CET for 'The ABCs of Graph Styling' 😍.

0
0
2

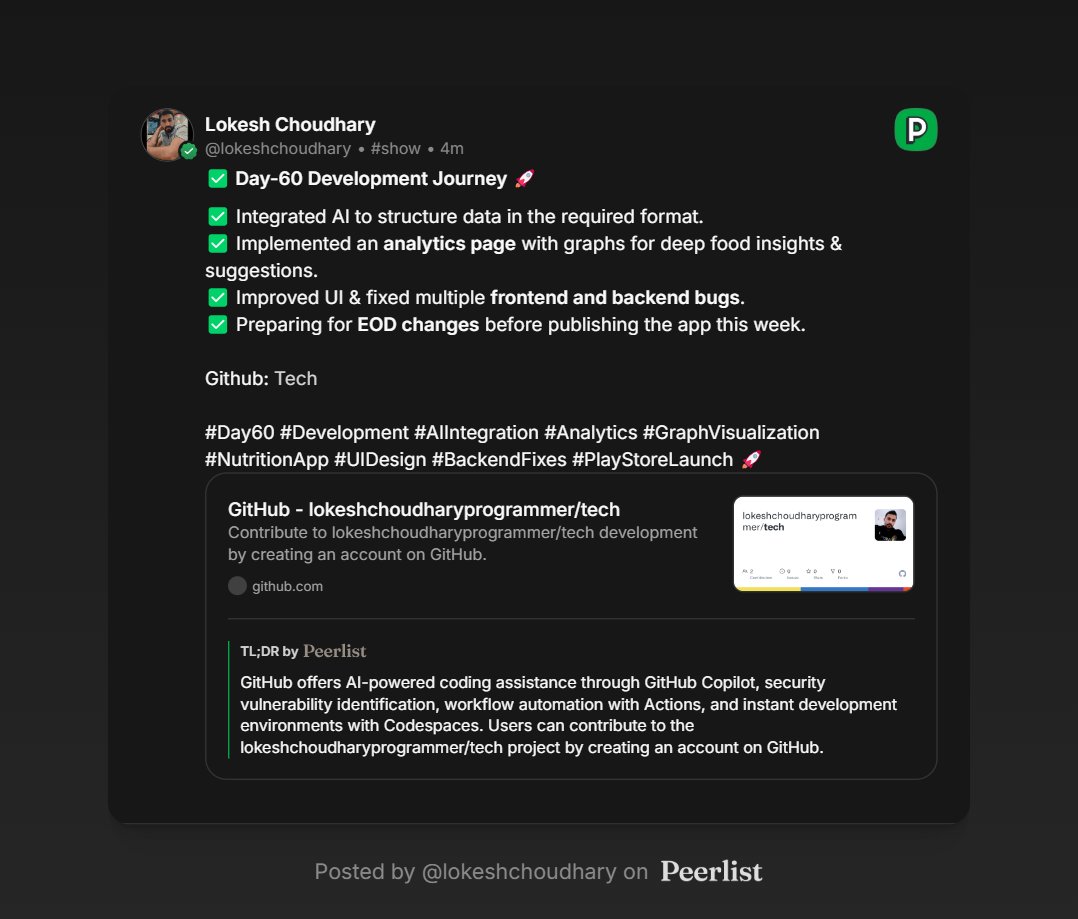
✅ Day-60 Development Journey 🚀. Github: #Day60 #Development #AIIntegration #Analytics #GraphVisualization #NutritionApp #UIDesign #BackendFixes #PlayStoreLaunch 🚀
0
0
1
🚀 Exciting News! 'The Art of #GraphVisualization' webinar series is back!. Join us TOMORROW, Feb 28 at 5pm CET for 'The ABCs of Graph Styling.' Don't miss out!. Register here 👉 #DataViz #Webinar #GraphStyling

0
0
3

Exciting news! G.V() now supports Dgraph, bringing interactive graph visualization to your data exploration toolkit. Connect, query, and visualize your Dgraph data effortlessly.. Discover more: . #GraphVisualization #Dgraph #GV

1
2
4

#AdventOfCode 2024 - Day 8.Easy one today. Indexes, MERGEs #Cypher and #GraphVisualization with #Neo4j #Bloom. puzzle: solution:

0
0
4

Linkurious Enterprise now offers Node Grouping, a powerful feature to enhance visualization efficiency and clarity. 🔎 Discover how this new feature works and can be applied to various use cases: #GraphVisualization #DataAnalysis
0
2
2
Join our free #webinar on August 14th: "Interactive Graph Editing for Devs." Learn advanced #programming and #GraphVisualization techniques. Perfect for all levels! Register now: . Register here:

0
0
2

Would you like to bring life into your #data? Our blog guides you through exploring the intricate connections and relationships within your #organization using #Neo4j and #Neo4vis.js. #DataAnalysis #DataScience #GraphVisualization #HTML #KnowledgeGraphs.

0
1
4

With our latest #GraphVisualization SDK versions, you can add images to node labels to make them more meaningful, instantly recognizable and unique. We've also updated our getting started tutorials to use open-source build tool Vite. Find out more:

0
0
0