Explore tweets tagged as #CensusEconData
Nonemployer businesses are key contributors to the #GigEconomy and our nation's economic growth. Dive deeper into the gig economy with our new #DataViz and #AmericaCounts story. . #CensusEconData #SelfEmployed

1
2
5
Privately-owned #HousingStarts in May 2025 were at a seasonally adjusted annual rate of 1,256,000. This is 9.8 percent below the revised April 2025 estimate of 1,392,000. 🏠 . #CensusEconData #ResidentialConstruction

0
6
7
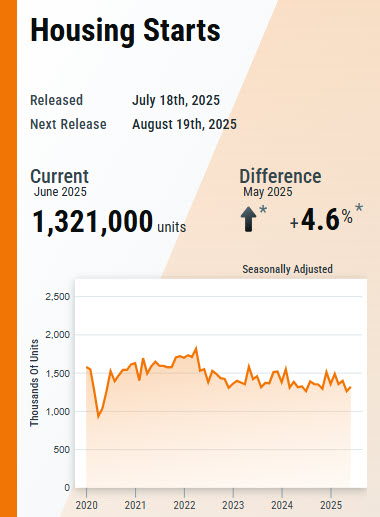
Privately-owned #HousingStarts in June 2025 were at a seasonally adjusted annual rate of 1,321,000. This is 4.6 percent above the revised May 2025 estimate of 1,263,000. 🏠 #CensusEconData #ResidentialConstruction
0
0
1
New #CensusEconData show the # of employer establishments in the U.S. ⬆️ by 0.8% from 2022 to 2023. Data for nearly 1,000 industries is available from our 2023 County Business Patterns, including the number of establishments, employment data, and more.

1
5
9

0
0
1
New economic data is now available for businesses within the #MarineEconomy that have no paid employees. Explore #CensusEconData on nonemployer businesses in sectors like tourism and recreation, ship and boat building, and marine construction. 🚤

0
4
3
Sales of new single-family houses in May 2025 were at a seasonally adjusted annual rate of 623,000. This is 13.7% below the revised April 2025 estimate of 722,000. 🏠 #CensusEconData #NewResidentialSales

1
4
5
Total U.S. #BusinessApplications were 457,407 in June 2025, up 2.2% from May 2025. Learn more: . #CensusEconData

1
1
4
New orders for manufactured #DurableGoods in May, up five of the last six months, increased $48.3 billion or 16.4% to $343.6 billion. Learn more: #CensusEconData #Manufacturing

0
3
3
Our latest Business Trends and Outlook Survey data show more businesses in #manufacturing subsectors reported they paid more for goods and services recently in 2025 than during the same period in 2024. Explore more #BTOS data: . #CensusEconData

1
3
4
While brick-and-mortar #retail clothing stores are disappearing, the number of U.S. electronic shopping and mail-order firms are on the rise. #CensusEconData tell the story of the U.S. retail industry. Read more on #AmericaCounts.

1
1
2
March 2025 monthly state-level retail sales are now available. #CensusEconData #MSRS #MonthlyStateRetailSales #RetailSales

1
1
1
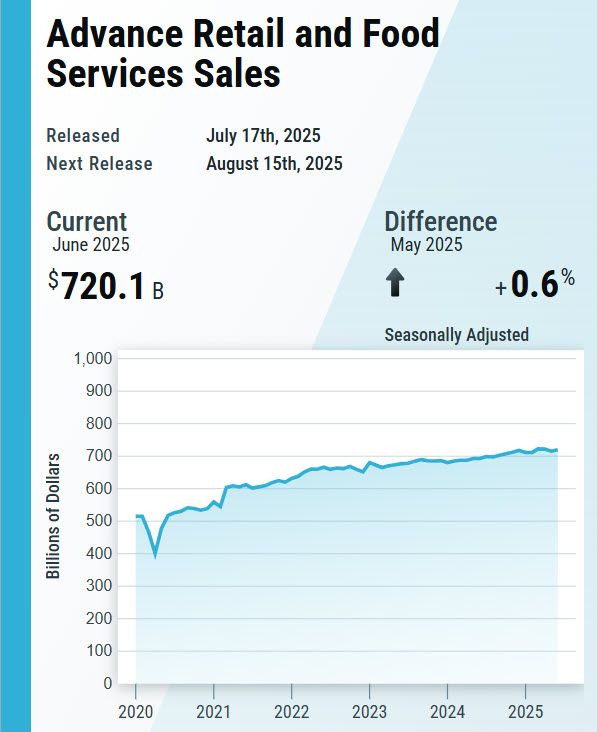
U.S. retail and food services sales for June 2025 were $720.1 billion, an increase of 0.6% from May 2025. Learn more: . #CensusEconData #RetailSales
0
2
5
Discover #CensusData on our nation's economy. #DYK, we provide a wide variety of economic data on businesses and industries in your community that are free and easy to use. We've pulled it all together for you: #CensusEconData

1
2
6
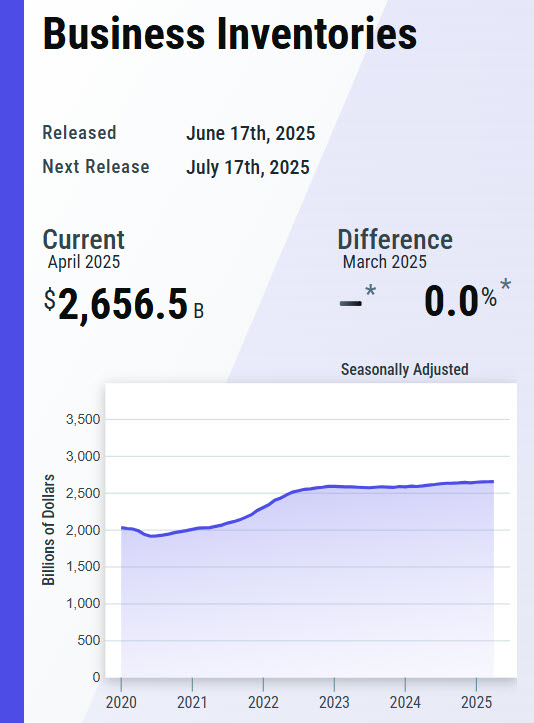
U.S. total business end-of-month inventories for April 2025 were $2,656.5 billion, virtually unchanged from March 2025. U.S. total business sales were $1,922.8 billion, down 0.1 percent from March. #CensusEconData #BusinessInventories
1
3
3
Shipments of goods in the U.S. reached 12.2 billion tons and $18.0 trillion, according to our Commodity Flow Survey. 🚚Trucks carried most of the load, hauling 68.1% of total tonnage in 2022. Learn more: . #CensusEconData

1
3
9

Today is National Small Business Day!. The life blood of our economy, support a small business today. Grow Your Small Business Now: #smallbusiness #smallbusinessmarketing #smallbusinessday #business #economicgrowth #SmallBusinessWeek #CensusEconData
0
0
0
New orders for manufactured goods in May, up five of the last six months, increased $48.5 billion or 8.2 percent to $642.0 billion. #CensusEconData

0
0
2
May end-of-month inventories were $905.4 billion, down 0.3% from April. #CensusEconData #AdvanceWholesaleInventories

0
0
2
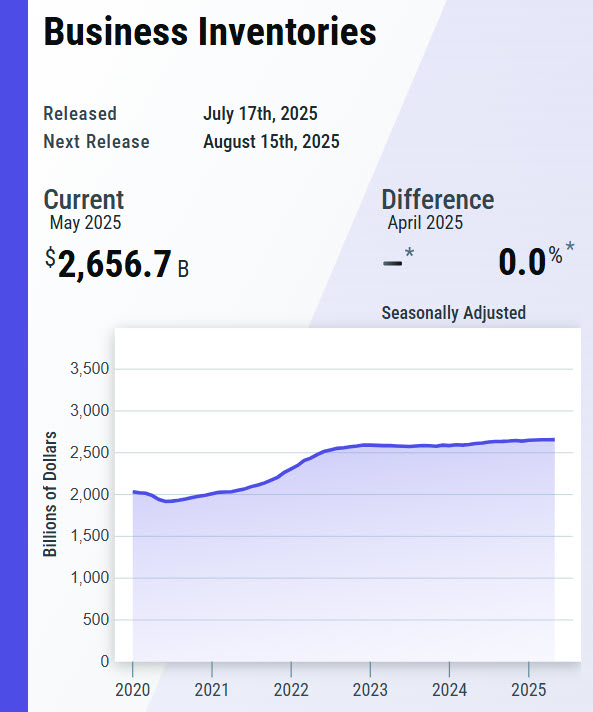
U.S. total business end-of-month inventories for May 2025 were $2,656.7 billion, virtually unchanged from April 2025. U.S. total business sales were $1,913.9 billion, down 0.4% from April. #CensusEconData #BusinessInventories
1
2
0