

Grafana
@grafana
Followers
66K
Following
5K
Media
2K
Statuses
6K
☁️ Open observability cloud ☁️ Join the Grafana community 👇
🌍
Joined April 2014
🇪🇸 #GrafanaCON 2026 is heading to Barcelona, Spain from 20-22 Apr! Get ready to feel on tapas the world at our biggest community conference of the year. This conference goes beyond #Grafana. It’s also about all of the other open source projects in our ecosystem
0
6
23
🧑🎓 New to #Grafana? Our popular "Getting Started with Grafana" webinar is back! Register to join us on Dec 10: https://t.co/8pzaFcP7jb We'll show you how to build your first dashboard, and how you can connect to a wide range of data sources, regardless of where it lives, to

grafana.com
In this webinar, we’ll demo how to get started using the LGTM Stack: Loki for logs, Grafana for visualization, Tempo for traces, and Mimir for metrics.
0
3
7
Back in May, we introduced the public preview of Grafana Drilldown Investigations, a new feature intended to help Grafana OSS & Grafana Cloud users accelerate their incident response. Now, as we head into the new year, we’ve made the difficult decision to deprecate this feature
0
2
4
🕰️ We're going back in time (with the time machine that never happened)... to the recording of #Grafana's Big Tent S3E1. Watch the new episode on #homelabs and #RaspberryPi stashes, featuring @ivanahuckova, @andrewmccalip, Brad Fitzpatrick, and hosts @matryer and @tom_wilkie:
1
0
6
You can now send #OpenTelemetry traces and logs from Cloudflare Workers to Grafana Cloud ☁️ The new #Cloudflare Workers integration for Grafana Cloud also offers pre-built dashboards, allowing you to quickly visualize and get value from your data. This includes the ability to
1
5
25
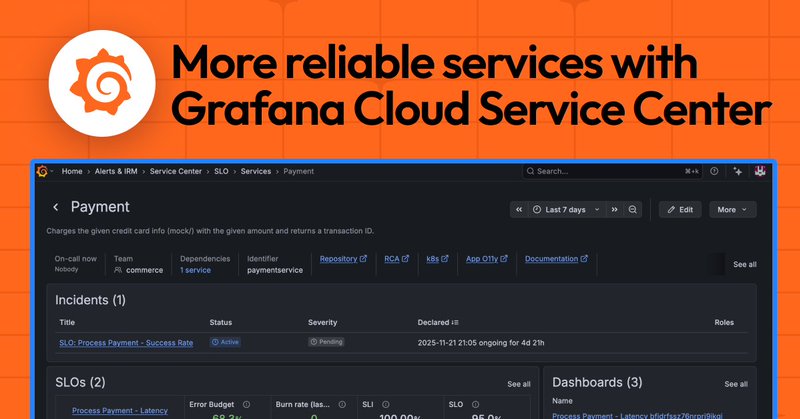
🛎️ The new Grafana Cloud Service Center is a comprehensive hub for all service-related activities. Monitor performance trends, minimize disruptive alerts, analyze past incidents, and understand on-call page load — all in one place.
grafana.com
With Grafana Cloud Service Center, teams can quickly discern whether services are performing well, identify areas requiring attention, and set priorities for investing in increased reliability over...
1
0
3
🎨 Some dashboards are more than charts. They're art. And they deserve the spotlight. Enter the #GoldenGrot Awards with a #Grafana dashboard you're proud of — personal or professional by 10 Feb 2026: https://t.co/YVYJWpQsll Learn more about the awards program and see past
0
1
10
🚗 We’re taking #ObservabilityCON on the road and this year, we’re opening the door for partners to join us as official sponsors. If you want to amplify your brand, connect with Grafana users, and engage directly with observability practitioners in your region, we’d love to hear
1
0
6
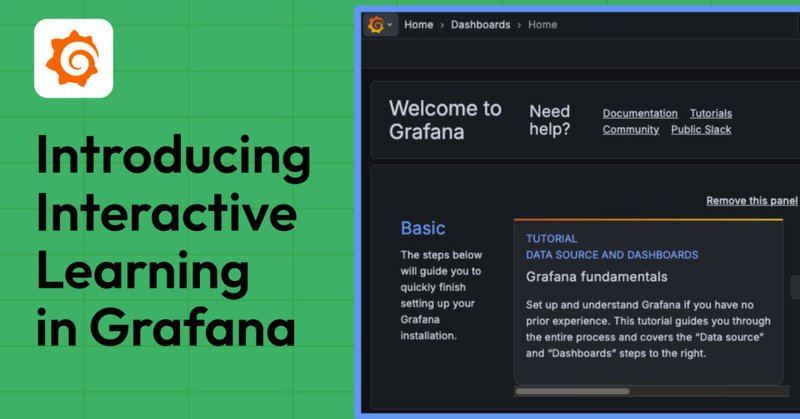
🧑🎓 The new Interactive Learning feature in Grafana 12.3 brings learning resources directly into the #Grafana platform. Find the answers you're looking for easily as you run into questions — no context switching required.
grafana.com
With Interactive Learning, we bring helpful and contextual learning resources into the Grafana platform, so you can find what you’re looking for quickly and easily — no context switching required.
0
4
15
🖥️ Meet the Alloy UI: your new debugging superpower. In Ep. 8 of Grafana Alloy for Beginners, Lisa Jung shows how to use Alloy’s UI to inspect component health, watch live telemetry flow, explore the visual pipeline graphs & debug issues fast. Watch: https://t.co/k4MikgA1cU
0
1
4
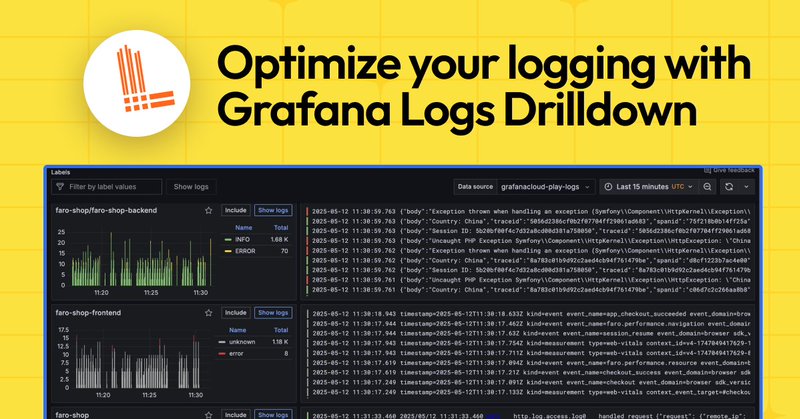
🪵 Logs can tell us so much about the state of our systems, but they can also be a bit overwhelming. See how Grafana Logs Drilldown can help you get the most out of your logs — whether you're new to Loki or highly proficient in #LogQL.
grafana.com
Whether you're new to Loki or highly proficient in LogQL, see how Grafana Drilldown can help accelerate troubleshooting and reduce MTTR for your infrastructure and applications.
0
1
12
🚀 “The features available in Grafana Cloud are tremendous: Application Observability, k6, Grafana IRM, Fleet Management… All things we didn’t even see in the paid enterprise version we were evaluating. They all looked so useful that we couldn’t pass them up.” – Zachary
0
1
9
That feeling when Grafana Labs finds a way... just in time for #AWSreInvent 😃 This is made possible through our new integration with Amazon CloudWatch & Amazon Data Firehose. Chat with us at booth #137 or learn more: https://t.co/7ubHV2v1wF
0
1
10
Webinar on Dec 3: Intro to Application and Frontend Observability with Grafana Cloud Register to join the live Q+A or to receive the recording: https://t.co/16fNiGPNX1 You'll learn how to: • Monitor application and frontend performance using Grafana’s out-of-the-box

grafana.com
In this webinar, we will introduce you to two of our latest opinionated solutions in Grafana Cloud that resolve issues faster with unified observability.
0
0
6
Correlations: a #Grafana feature that lets you jump from a chart to logs or traces w/ 1 click. The time range & label values are carried automatically — no copying + pasting, no new agents. Learn how to use them with 3rd-party data in Grafana. https://t.co/ck48WEHSVC

grafana.com
Learn how easy it is to start using correlations with third-party data in Grafana. Jump from a chart to logs or traces with one click—no copying and pasting, no new agents.
0
0
6
In part 2 of our complete guide to observing #AI agents on #AmazonBedrock #AgentCore, we focus how to monitor the infrastructure layer. https://t.co/BuUPEwKvfw

grafana.com
Learn how to use OpenTelemetry, Amazon CloudWatch, and Grafana Cloud to track essential performance and financial metrics for Amazon Bedrock AgentCore.
0
2
2
3 days until the Grafana Labs team is at #AWSreInvent. Swing by booth #137 and our experts will walk you through: 🔸 AWS observability in Grafana Cloud 🔸 Easier, faster, and more cost-effective observability with our latest #AI/ML developments Book dedicated time to
0
1
1
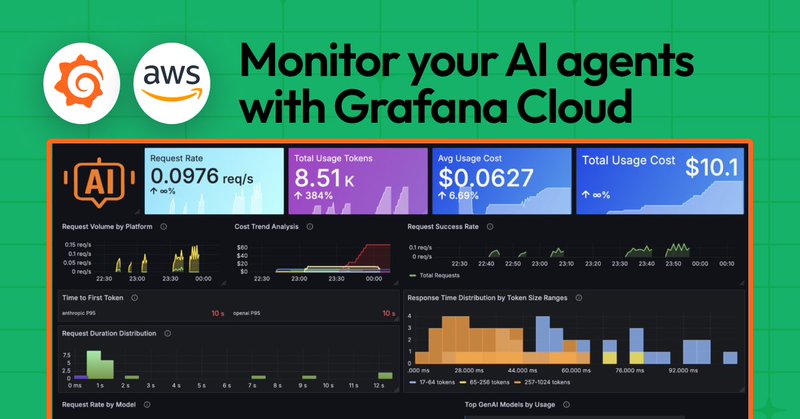
#AI agents offer all sorts of benefits, but they can also be notoriously difficult to monitor. Follow this guide to see how you can use #Grafana Cloud to monitor agents built in #AmazonBedrock #AgentCore.
grafana.com
Learn how to use OpenTelemetry and Grafana Cloud AI Observability to track your Amazon Bedrock AgentCore agents to debug production issues and optimize costs.
0
4
19
🙏 Feeling extra grateful for our wonderful community today. Whatever LGTM+ means to you today — Leftovers Go To Me; Let’s Give Thanks, Mate; Limitless Gravy and Turkey Mayhem; or simply Loki, Grafana, Tempo, and Mimir — we wish you a happy Thanksgiving!
0
1
3

The 4th annual Observability Survey is in motion & we need your input! Share your (anonymous) input on tooling, AI, cost & complexity in ~10 mins for a chance to win #Grafana swag. We'll publish a free report for the community. Take the survey: https://t.co/xRLkyfrWwd
0
1
3