

Gene Ma
@genemaIIF
Followers
4K
Following
328
Media
218
Statuses
397
Head of China Research & APAC Chief Rep @iif; Formerly Tudor Investment, Evercore ISI, and Citics.
Singapore
Joined February 2017
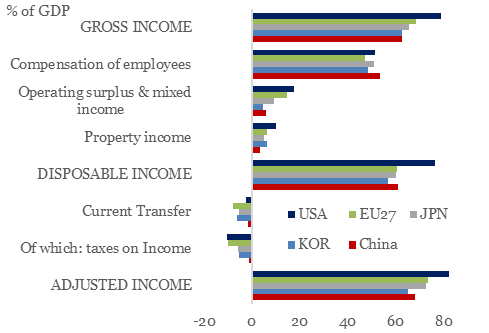
Consumption/GDP = C/Income * Income/GDP. Chinese household disposable income was 61% of GDP, at par with the EU and Japan, and slightly higher than in Korea, thanks to low direct taxation. Thus, China's low C/GDP is due to high savings (and probably data issues), not low income.
1
0
2
Where are China's rail, port, and power stations? Well, China's engagements in these sectors are mainly through "Overseas Contracted Projects" (OCPs), which are contracted construction works instead of equity investments. These OCPs are now greater in value than ODIs.

0
0
1
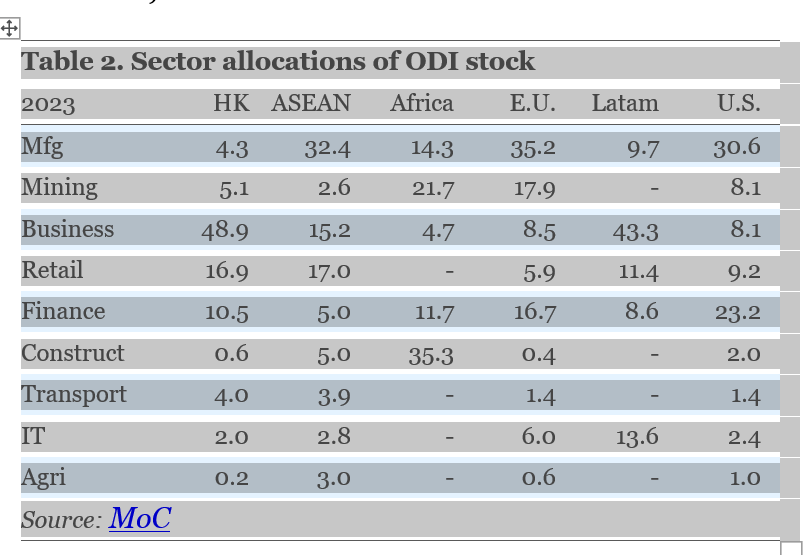
Sectoral allocations vary significantly by region. Although manufacturing represents only 10% of total ODI, it is the dominant sector in China’s ODIs in ASEAN, the EU, and the US, accounting for roughly one-third of the total (Table 2).
1
0
0
Despite the media hype, China accounts for only 0.6% and 1.1% of the FDIs in the US and EA.

1
0
1
60% of China's ODI stocks are in HK, with another 20% in the Cayman Islands and the BVI. This money is probably invested in Chinese companies registered abroad as foreign companies. Thus, China's ODI stock invested outside these offshore financial centers is much smaller.

1
0
0
Though growing rapidly in recent years, China's ODI stock is still small relative to its GDP, at 16.7% vs. 57% for Japan. If the ODIs to HK are taken out, China's ODI stock becomes even smaller.

1
0
0
We recently published an analysis of China’s outbound direct investment, which has exceeded the annual flow of inward FDI in recent years. Yet, the reality may diverge significantly from prevailing perceptions.
1
1
3

A once-symbiotic melding of American capital with Chinese growth is unraveling https://t.co/T6ttBZUVkR via @WSJ

wsj.com
A delisting push is adding to the unraveling of Wall Street’s love affair with China Inc.
1
2
4
China is now firmly a net capital exporter beyond its official reserves. While non-resident inflows are expected to be far below the $683 bn peak of 2021, resident outflows will likely remain near $500 bln annually in 2025–26. China's role in global capital flows has pivoted.

0
0
5
Non-resident FDI and portfolio inflows have collapsed since 2022. It will take time for these inflows to recover.

1
0
2
Portfolio outflows by Chinese residents reached record highs in 2024, especially the southbound equity flows to HK. We expect resident equity and bond portfolio outflows to narrow in 2025-26 but remain substantial and greater than non-resident inflows.

1
0
1
Many hope that more Chinese consumption will help rebalance global trade. Unfortunately, Chinese consumers will spend more on services as they get richer and older, with limited spillover into goods imports.


0
0
8
Since 2012, ASEAN's trade balance with China has shifted from small surpluses to deficits. By 2024, this deficit had expanded to 5.7% of ASEAN GDP, while ASEAN's trade surplus with the rest of the world increased to 7.1%. ASEAN benefitted from the rapid growth of trades.

0
0
0
Over the past decade, trade and FDI between China and ASEAN have surged, driven by supply-chain reconfiguration, improved transportation, and the implementation of the RCEP in 2022. ASEAN surpassed the US in 2019 and the EU in 2020 as China's largest trading partner.

1
0
3
Even steelmakers' capacity utilization was not as bad as many thought. Steel overcapacity was an issue in 2014-16 due to the rapid capacity expansion after the GFC. The drop in utilization in 2023-24 was due to the housing slump, not capacity building.

0
1
0
China's capacity utilization rates of chemical fiber, non-ferrous metal, and machinery were all near record highs. The low utilization of car makers was due to the plummeting demand for ICE cars. The overall utilization of EV makers was at an acceptable level.

1
1
0
Even the relations in 2024 varied. Last year, non-metal and F&B suffered from overcapacity, yet they could not increase their exports. Non-ferrous exports surged, but this was due to strong external demands, not domestic overcapacity.

1
1
0
Is China's robust exports the result of overcapacity? Here, we measure overcapacity using capacity utilization. A large capacity is not necessarily overcapacity. Maybe in 2024, due to the housing slump, but not in most other years.

1
2
0
As local governments fiscal health deteriorates, central govt is using its balance sheet to raise debt to support the transfers. CGB issuance increased from 60% of LGBs in 2021 to an expected 128% in 2025.

0
0
0
