

Flourish
@f_l_o_u_r_i_s_h
Followers
17K
Following
2K
Media
926
Statuses
2K
Bring data to life with stunning, interactive visuals on Flourish – your go-to data storytelling platform, part of Canva.
London
Joined May 2016
New look, same storytelling power!✨. Our refreshed brand embodies everything we stand for—human, truth, and magic—while empowering you to tell great stories with data. Data storytelling has never looked so good. Ready to create some magic? Get started:
3
4
19
RT @jburnmurdoch: Ever wondered why some charts are more effective and engaging than others?. I’ll be going through all the theory, evidenc….
0
28
0
Some of the most talked-about charts in recent years? @jburnmurdoch was behind them. Now, he’s teaming up with us for a special 3-part webinar series to help you turn data into stories that inform, inspire, and stick. Whether you're just getting started or looking to level up,

3
1
1
At Canva Create, we asked: What if everyone could feel confident with data?. Spoiler alert: Now you can. In case you missed it: our CEO Duncan Clark took the stage to unveil a powerful suite of tools, designed to help everyone, even the data-shy, feel confident turning numbers


0
0
2
Tomorrow’s the day! Don’t miss your chance to turn data into impact. Join us for a free, hands-on webinar where we’ll break down the essentials of powerful data storytelling. You’ll learn how to turn raw numbers into eye-catching visuals using Flourish in Canva – with live demos

0
0
0
✨ What happens when data storytelling takes the spotlight? ✨. Data was front and centre at #CanvaCreate – with Flourish at the heart of it, powering new ways to turn numbers into stories. We unveiled two major updates:. 📊 Start with Data – a faster way to turn numbers into
0
0
3
We hit the stage at Canva Create to reveal two exciting updates designed to make data storytelling easier and more powerful. 🚀📊✨. Start with Data – upload your dataset and get chart suggestions in seconds, so you spend less time guessing, and more time creating. Flourish app

0
0
4
📣 Don’t forget! Our free webinar on data storytelling is almost here. Discover how to turn raw data into unforgettable visuals using Flourish in Canva. From practical tips to live demos, we’ll walk you through the essentials of clear, compelling data storytelling step by step.

0
0
1
We’ve got a few surprises at Canva Create, and you’re on the guest list 👀. Join us live in L.A. or stream online as we reveal what’s next. You won’t want to miss this!. 📍 Click here for all the details:

0
0
1
Got data? Let’s make it unforgettable. Join us for a free webinar on the foundations of clear, compelling data storytelling—and discover how easy it is to bring your visuals to life with Flourish in Canva. We’ll take you from raw data to standout charts, with practical tips and

0
0
1
(2/2) Explore our blog for tips on turning those basic chart labels into powerful storytelling tools:


0
0
0
(1/2) Legends are key to any great data visualization—but are you tapping into their full potential?


1
0
0
Formula 1 isn’t just a test of speed on the track—it’s a logistical challenge across the globe! 🌍. This season, teams will travel thousands of miles between races. Explore our mapping of the 2025 F1 calendar and see just how far the action moves from one round to the next.
0
1
3
Is your chart telling the full story? 📊. If your data feels squished on one side or skyrockets unexpectedly, your scale might be the culprit. Learn when to use linear vs. logarithmic scales to make your visualizations clearer and more impactful. 👉Read more:
0
0
4
Are any of these in your TBR pile? Do you have more recommendations? Let us know and happy reading! 📖


0
0
2
Need some inspiration for the data corner in your bookshelf? 📚. This #WorldBookDay, we teamed up with data storytelling expert and author Andy Kirk to share a selection of must-read books for data enthusiasts. Check out this thread to find your next read 👇


4
0
4
🏆 Best Picture is often just the start – many winners sweep the Oscars in multiple categories. Alongside Best Picture, this year Anora walked away with four other awards, including Best Actress and Best Director. Did it deserve them all, or do you think another film should have

1
0
4
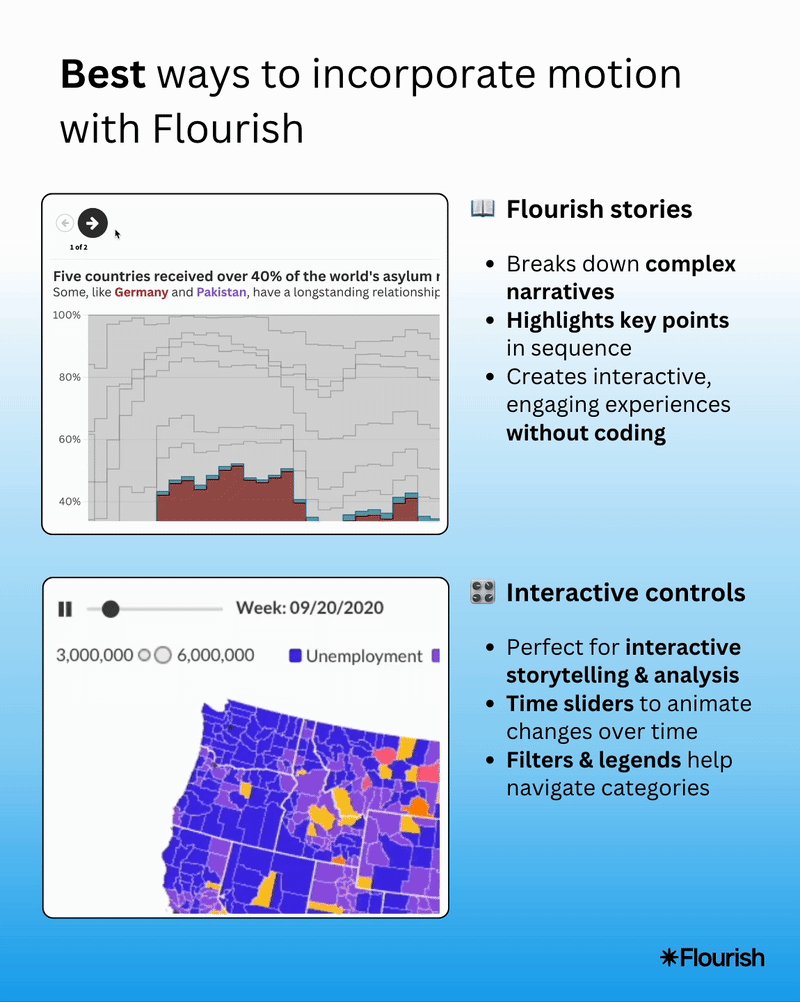
Want to bring your charts to life? Watch our latest webinar:
0
0
0
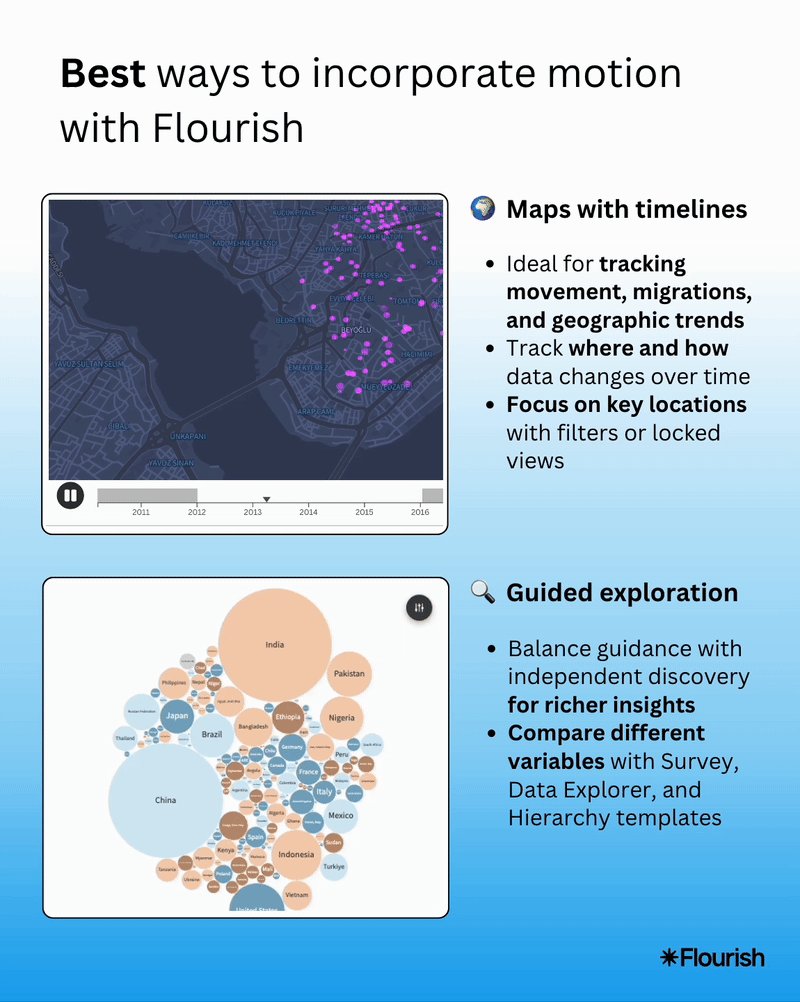
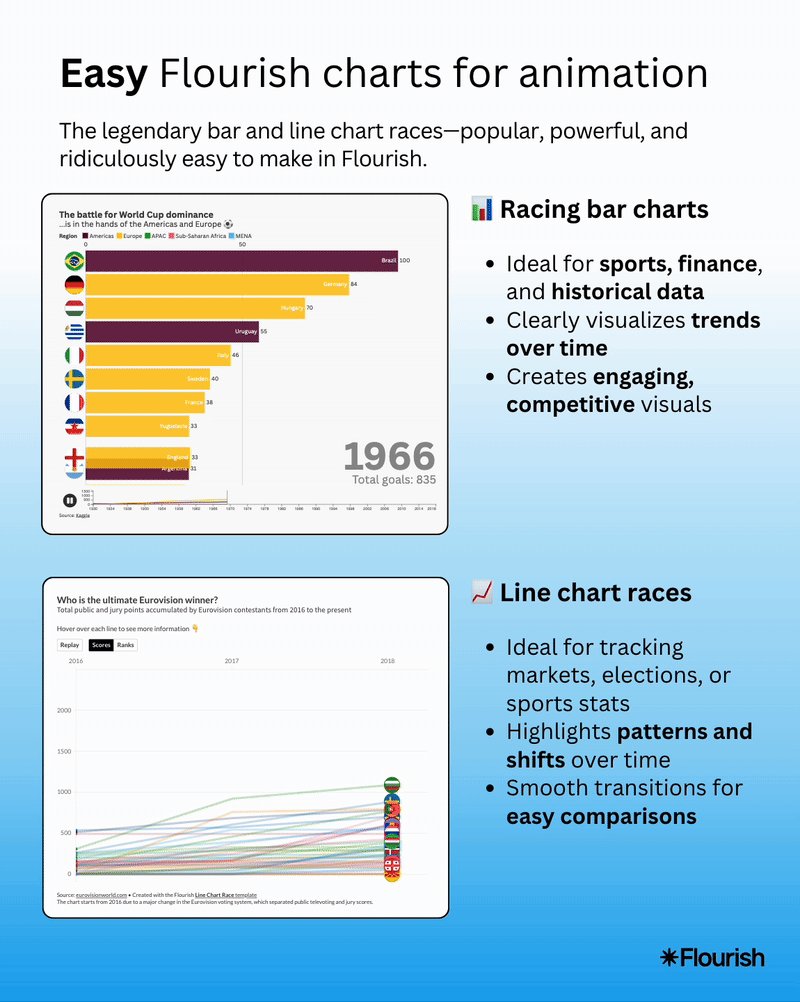
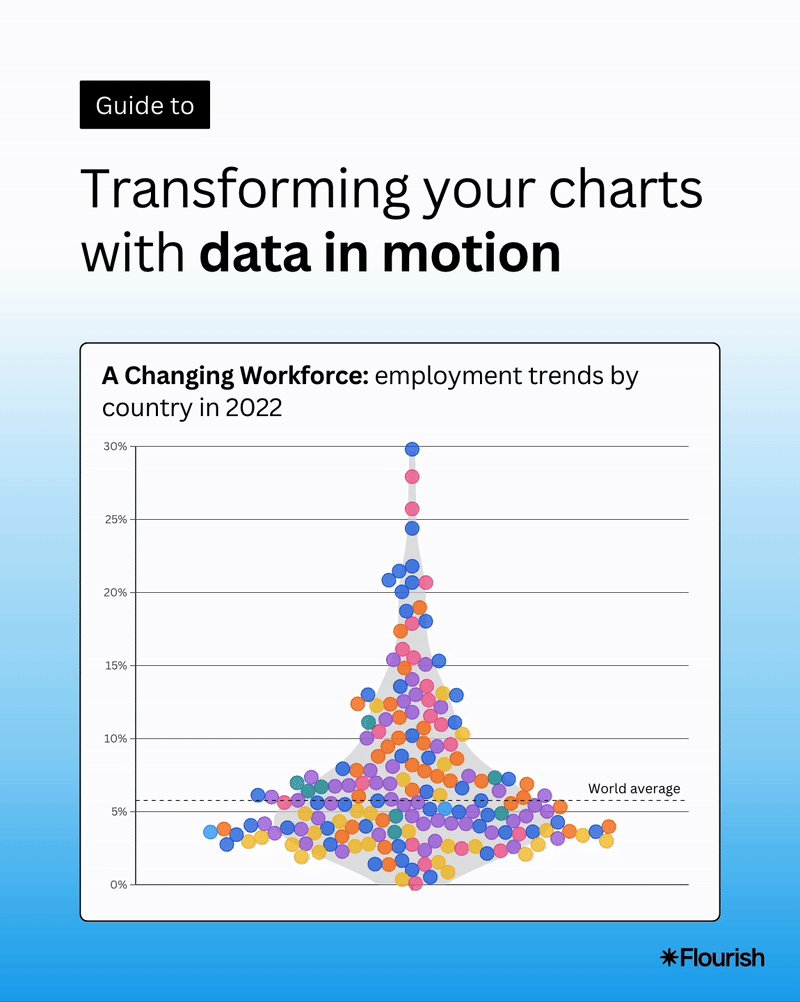
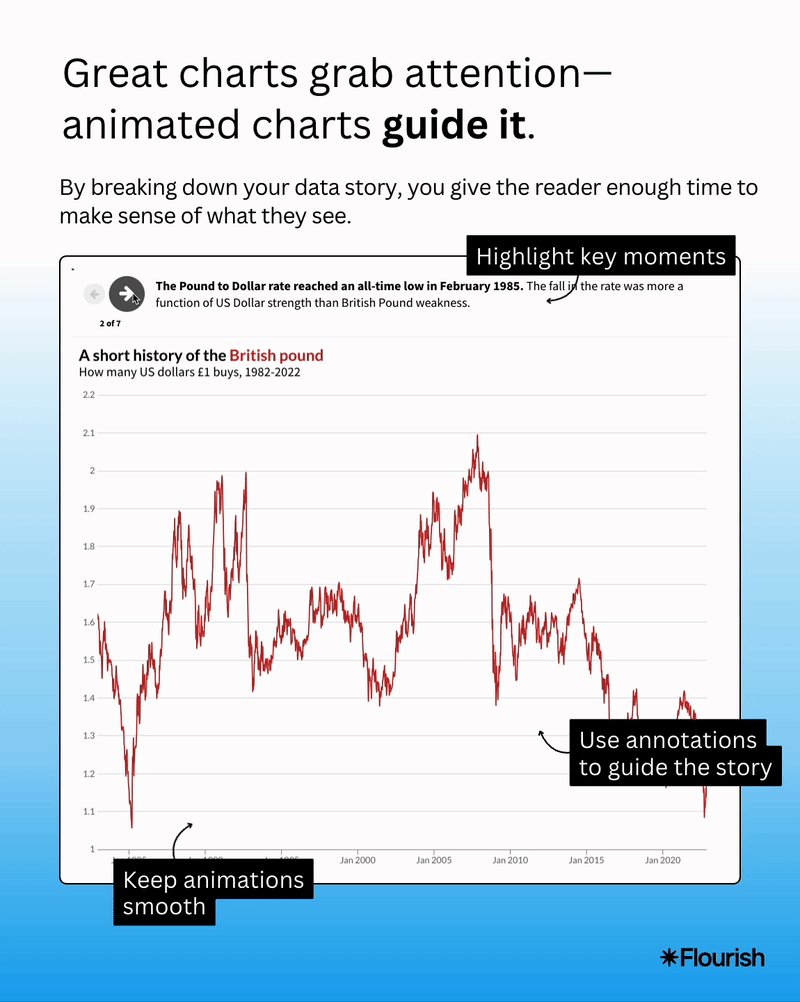
From racing bar charts to animated maps, motion makes insights clearer, more engaging, and impossible to ignore. The right animation won’t just show your data—it’ll tell a story.
1
0
1
Making data memorable is hard. There’s more information than ever, and attention spans are shorter than ever. But when data moves, people notice.

3
0
2
🚀 Exciting news! We’re thrilled to be supporting DataComms Live - London’s leading conference on data insight, analysis, and corporate communication by @Communicatemag. On May 20th, we’re taking the main stage with a special case study session and hosting two expert
0
0
1