
Build Alpha
@buildalpha
Followers
6K
Following
627
Media
96
Statuses
3K
Build Alpha Trading Software creates, tests and codes trading strategies with the click of a button. Watch demos: https://t.co/805DCHUn1P https://t.co/jKcyIHc3ol
Boca Raton, FL
Joined January 2017
Some recent posts in case you've missed what I've been up to The Noise Test - how to find lying backtests https://t.co/FCjqMwI8qV COT Report - using trader positioning for context https://t.co/VvhSDrM2Sg Market Breadth - monitor and test market health https://t.co/BfYJ8Ce2CA
Price tells you what the market did. Market Breadth tells you how many stocks participated. When you want to understand market health, breadth is where you look. 🧵👇
0
3
11
COT data won’t replace price. It is not supposed to.
But it does explain the environment price is operating in. 👉 Read more:
https://t.co/BXgb8wnK9C
0
1
5
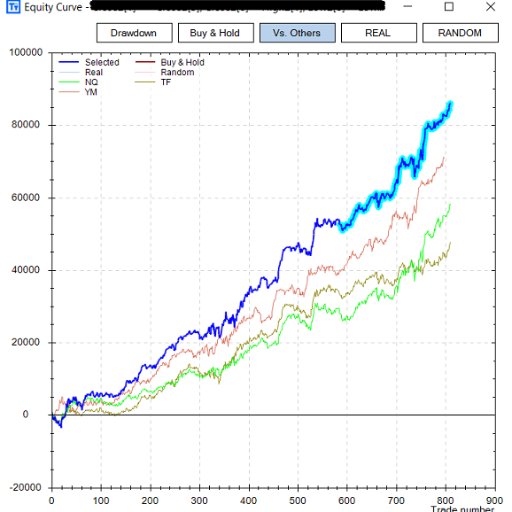
Example (details in the article):
Simply being long Nasdaq when large speculators are less bullish dramatically outperformed buy-and-hold over long horizons (risk normalized) Maybe counter-intuitive — and exactly why this data matters. And exactly why you should TEST
1
2
8
In Build Alpha, COT data is:
• cleaned
• normalized
• available back to 2000
• usable point-and-click You can test COT Index ranges, net positioning, or require COT alignment while BA searches for complementary price signals.
1
0
1
COT data is useful as:
• a filter
• a regime identifier
• a way to align price signals with positioning Price patterns behave very differently depending on who’s already committed.
1
0
1
A COT Index of:
• 100 = most bullish in 3 years
• 0 = most bearish in 3 years Extreme readings often align with regime shifts, trend exhaustion, or major inflection zones — not precise entries.
1
0
1
Two common ways to turn COT data into usable signals: *Normalized net position (Net longs – shorts) ÷ open interest *COT Index
Where current positioning sits relative to the last 36 months
1
0
1
First, raw COT numbers alone aren’t very useful. Is 10,000 contracts long bullish or bearish?
You can’t tell without knowing:
• total open interest
• historical extremes
• relative positioning Normalization matters.
1
0
1
COT data is not a timing signal.
It’s slow, weekly, and structural. Its real value is context — understanding the environment price is moving through, not calling tops and bottoms. Think filter, not signal. If the largest players are net long do you think it is a good idea to
1
0
1
COT splits traders into three buckets: • Commercials (hedgers) – producers, merchants, institutions managing risk
• Non-commercials (large speculators) – hedge funds, CTAs, large traders
• Non-reportables (small traders) – positions below reporting thresholds The latter
1
0
1
The COT Report shows open interest positioning in futures and options markets. It breaks positions down by trader type and reflects data as of Tuesday’s close, released Friday afternoon.
1
0
1
Every Friday, the CFTC releases one of the most underused datasets in trading:
the Commitment of Traders (COT) Report. It doesn’t predict price — but it does reveal who’s positioned where. 🧵👇
1
2
6
Market Breadth helps you see what price alone can’t. It’s one of the simplest ways to add context, reduce fragility, and understand market regimes. 👉 Full guide + signals available:
https://t.co/BJFgjfv7ck
buildalpha.com
Add context to price action trading systems by looking at market breadth. Look under the hood to see how healthy a rally truly is. No Code.
0
0
1
Ask better questions:
• Does my strategy work when breadth is weak?
• Should I trade breakouts when participation is narrow?
• Do mean-reversion signals improve when sentiment is extreme? TEST EVERYTHING!
1
1
3
Breadth works best when combined with:
• price action
• volatility structure
• intermarket data
• news events Edges rarely live in isolation. They need alignment.
1
0
1
In Build Alpha, Market Breadth & Sentiment signals are: •built-in •fully backtestable •optimizable •usable as entries, exits, or filters No coding required.
1
0
1
Breadth and sentiment can:
• filter systems ON or OFF
• define regimes
• explain why signals fail in some environments
• reduce false positives They don’t replace price — they inform it.
1
0
1
Breadth overlaps with sentiment — how investors are positioned and feeling. Surveys (AAII, NAAIM), Google Trends, and dark pool activity often reveal stress before it shows up in price. Humans are most predictable under pressure. Look at Google Search Trends for "Recession"
1
0
1