

Bryan Tineo
@bryanmax92001
Followers
24
Following
1K
Media
80
Statuses
106
🦔Hedgehog Coder 24/7. AI/Machine Learning Software Engineer. Learn with me about Cyber security , AI, Web, etc…
Long Beach
Joined April 2024
This is really funny coming from Grook. Happy new years everyone!!🎉

0
0
2
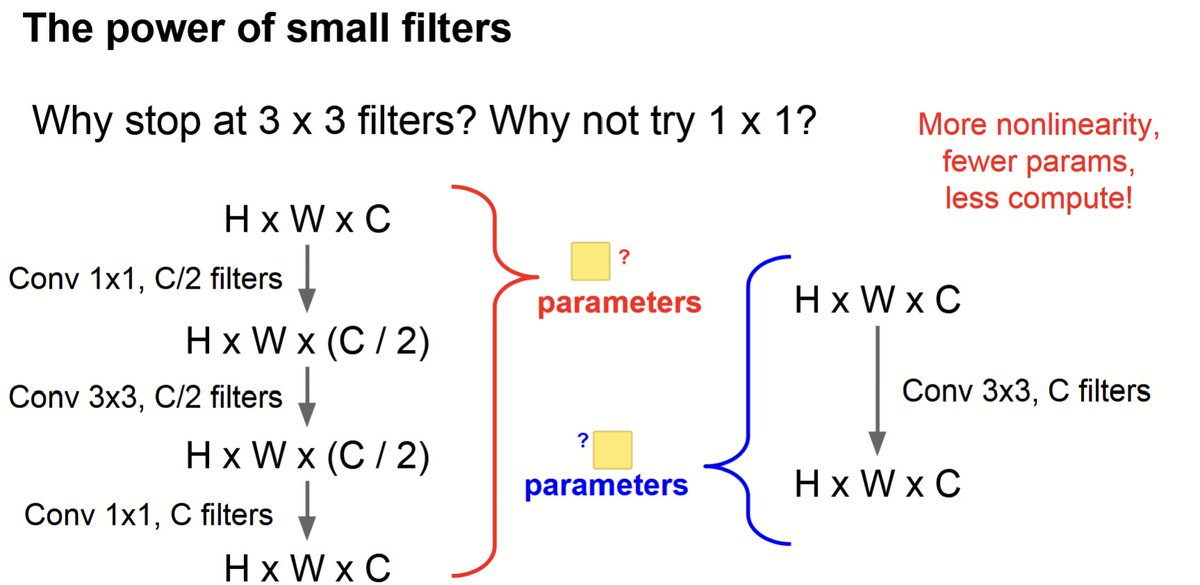
The bottleneck structure: .optimizes neural networks by reducing depth with a 1×1 convolution, processing features with a 3×3 convolution at reduced depth, and restoring depth with another 1×1 convolution. This reduces parameters, adds non-linearities, and improves efficiency.


0
0
2
Optimizing Parameters with Smaller Filters.To calculate weights, a 7×7 convolution uses C×(7×7×C)=49C^2, where C filters preserve depth. For three 3×3 convolutions, each uses C×(3×3×C)=9C^2, and with three layers, the total is 3×9C^2=27C^2. Smaller filters add non-linearity.

0
0
2
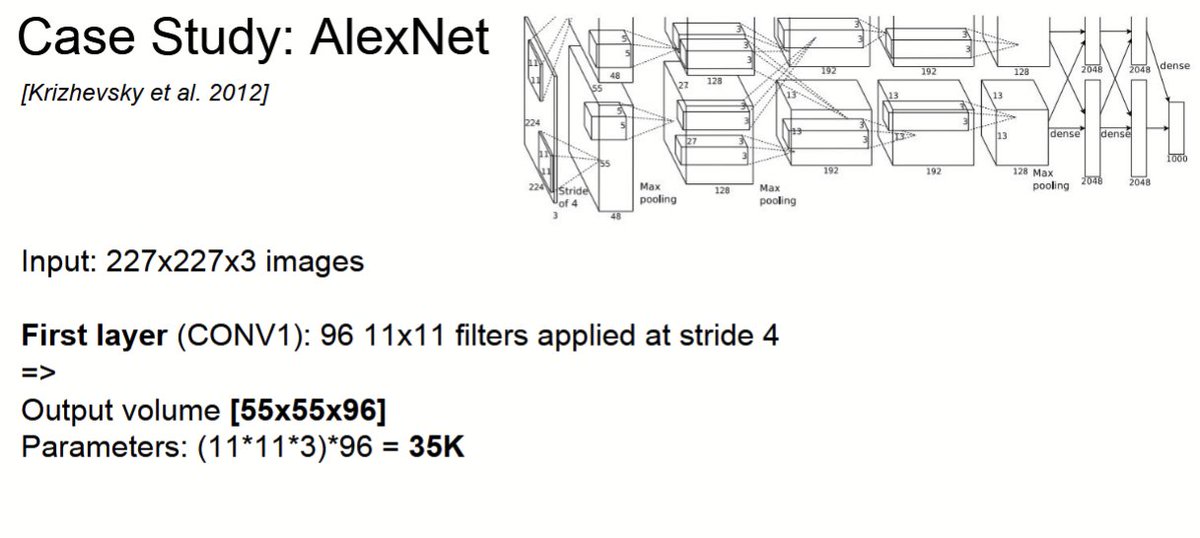
To calculate the total parameters in a convolutional layer, multiply the filter size (height × width) by the input channels, add 1 for the bias, and multiply by the number of filters. For example, 11×11×3+1=364 parameters per filter, and for 96 filters, the total is 364×96=34,944

0
0
2
Fine-tuning updates the final layer and selectively adjusts pre-trained weights, freezing earlier layers if needed to avoid overfitting. Using a pre-trained model as a feature extractor freezes all but the final layer, which is replaced and trained to fit the new dataset.

0
0
2
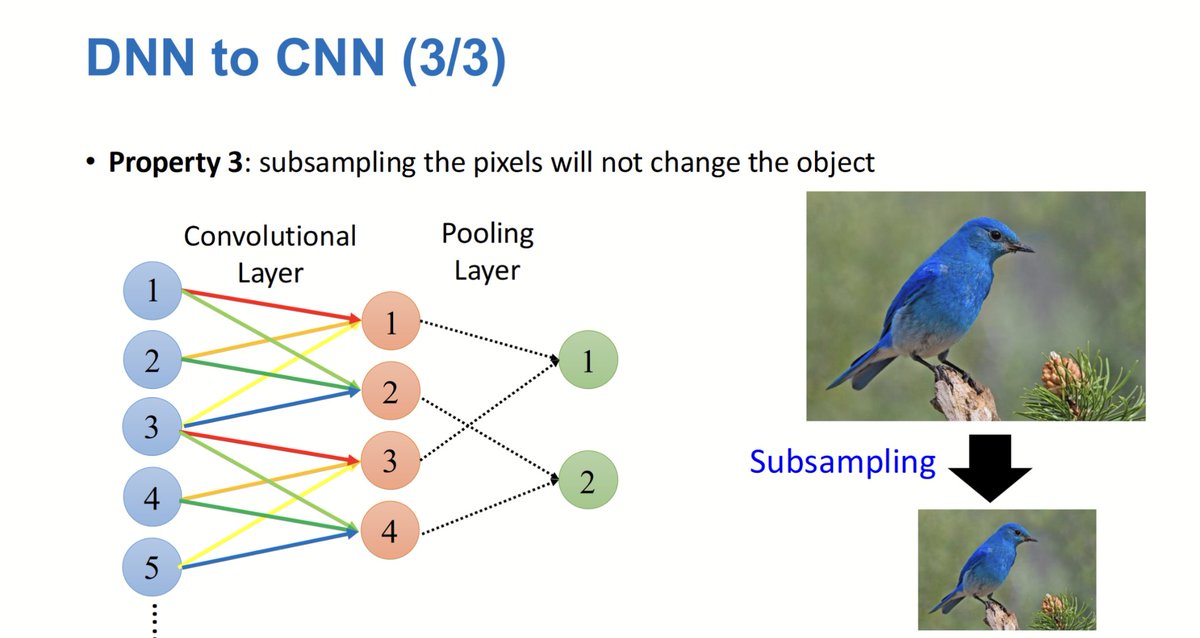
Max pooling downsamples feature maps by taking the max value from each 2x2 region with stride S=2. The output size is calculated from the 224x224x64 input, derived from the previous convolution layer's feature maps.


0
0
2
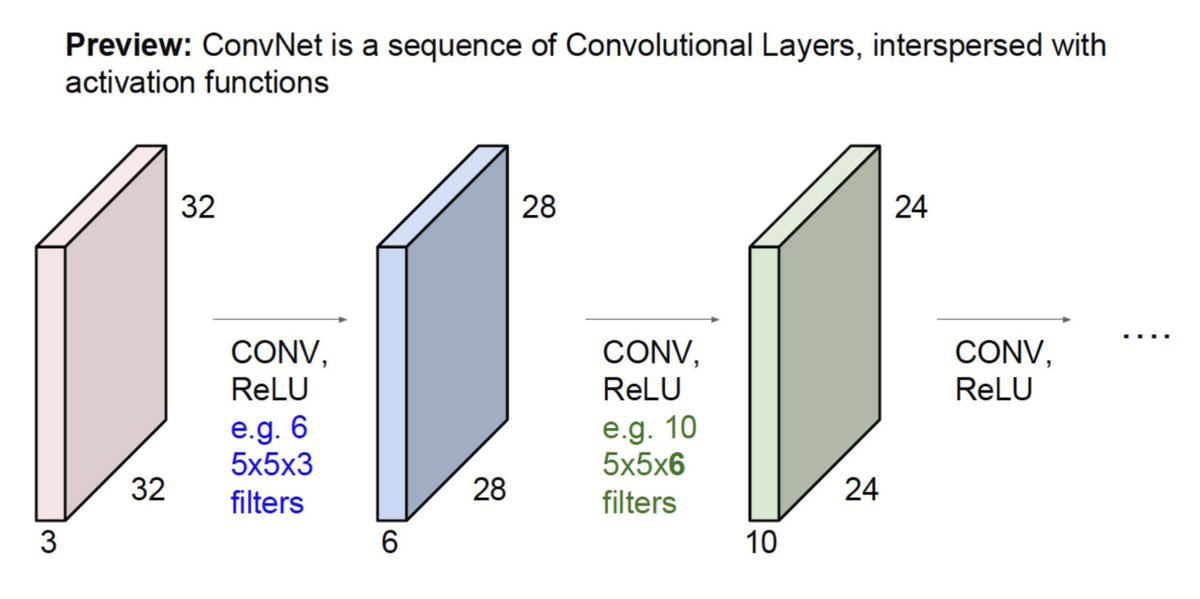
A Convolutional Neural Network:.Processes an image by applying convolutional layers to extract features, followed by max-pooling layers to reduce spatial dimensions and retain important information. This sequence can repeat multiple times for deeper feature extraction.

0
0
2
To calculate the total parameters in a convolutional layer with 10 filters of size 3×3×3, each filter has 27 weights plus 1 bias, resulting in 28 parameters per filter. With 10 filters, the total parameters are 28 × 10 = 280 parameters.


0
0
1
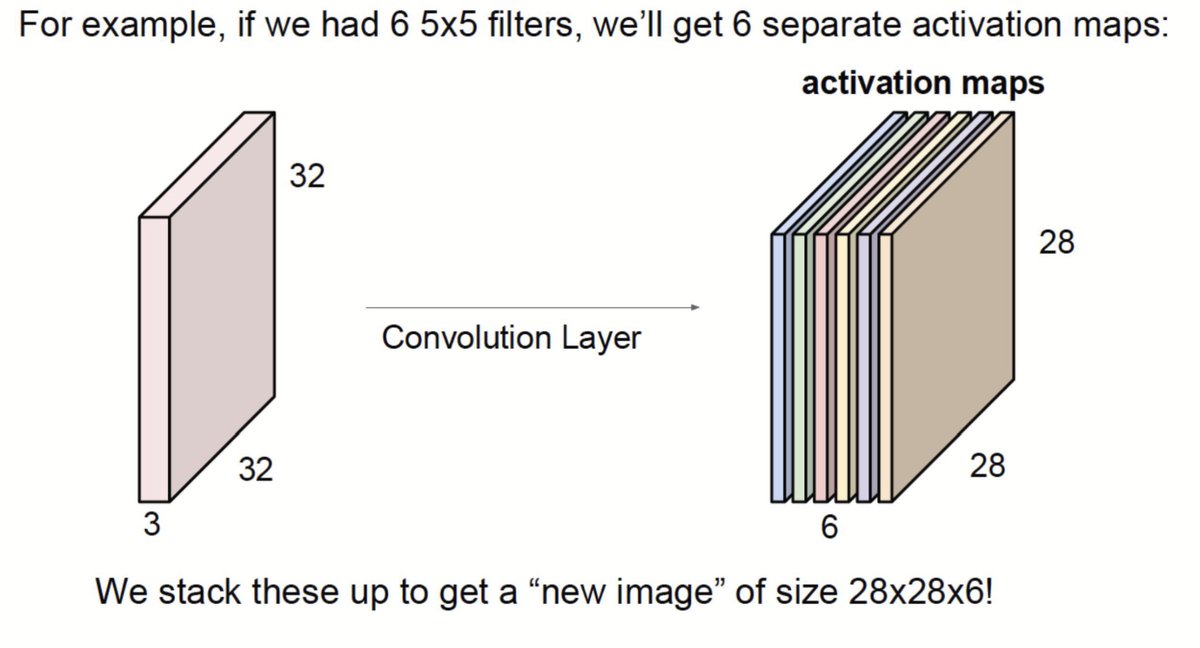
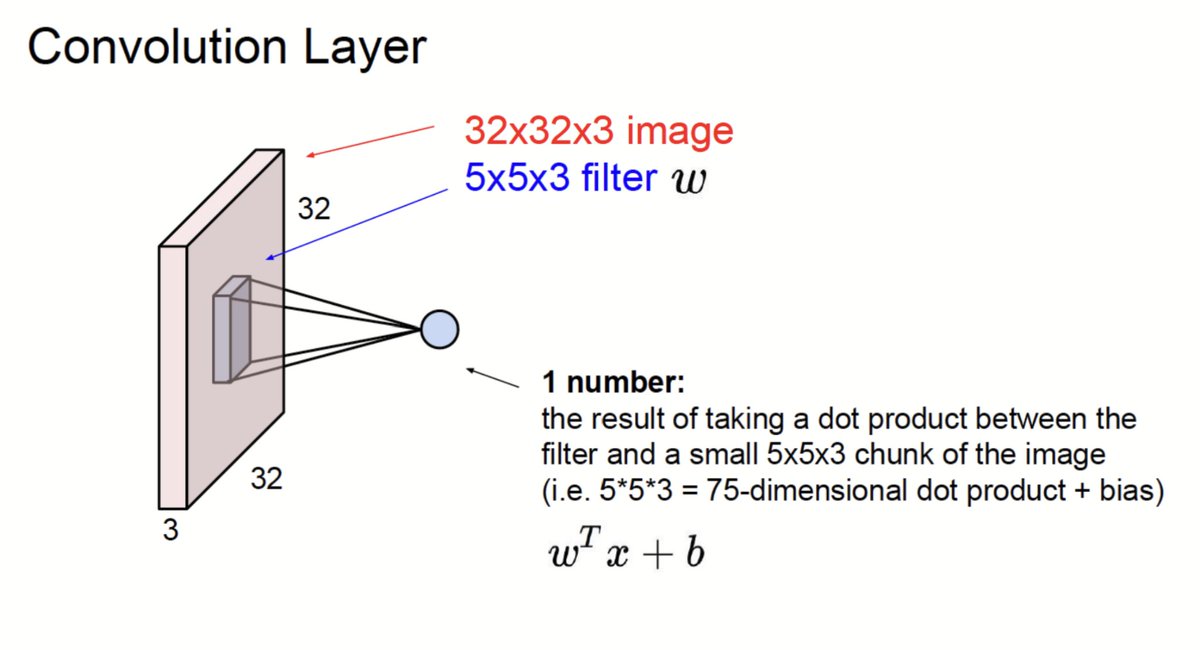
Convolutional Layers:.Apply filters to extract features like edges and textures by sliding across the image, performing dot products, and generating feature maps. The formula calculates output dimensions for efficient feature extraction and reducing image size for classification.


0
0
1
Convolution:.The formula displayed calculates the dimensions of the output from a convolution operation. Here, n is the size of the input 7×7, f is the filter size 3×3, p is the padding added to the input (0 in this case), and s is the stride.

0
0
2
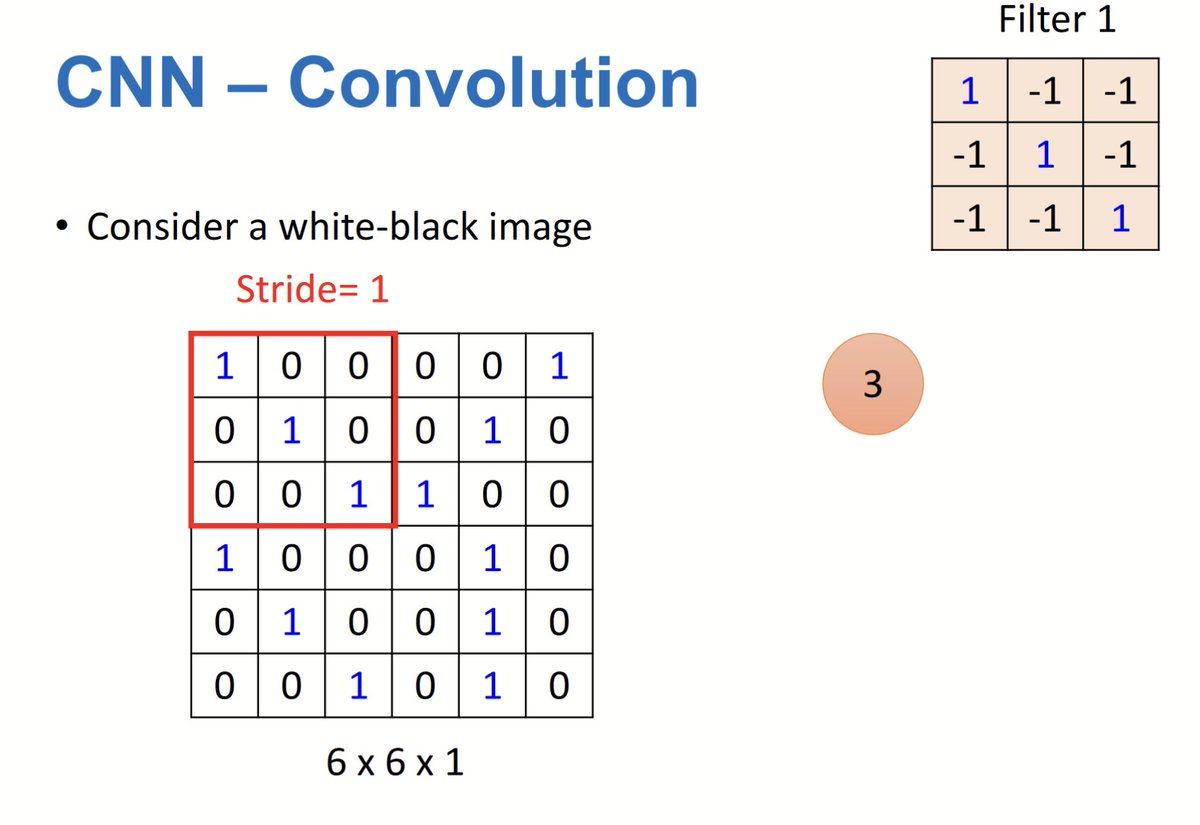
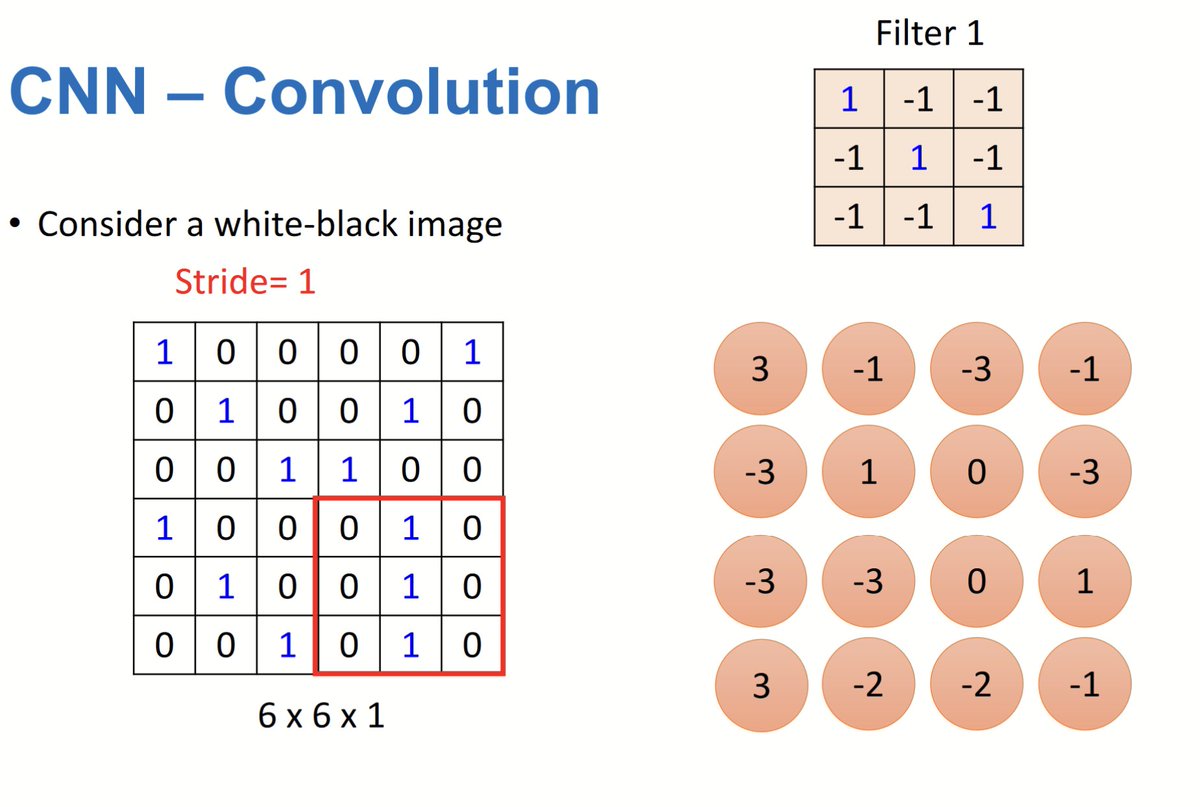
CNN:.Convolution applies a small filter matrix to detect patterns like edges, performing element-wise multiplication and summation. Creates a smaller feature map with key features for tasks like classification and object detection.


0
0
1
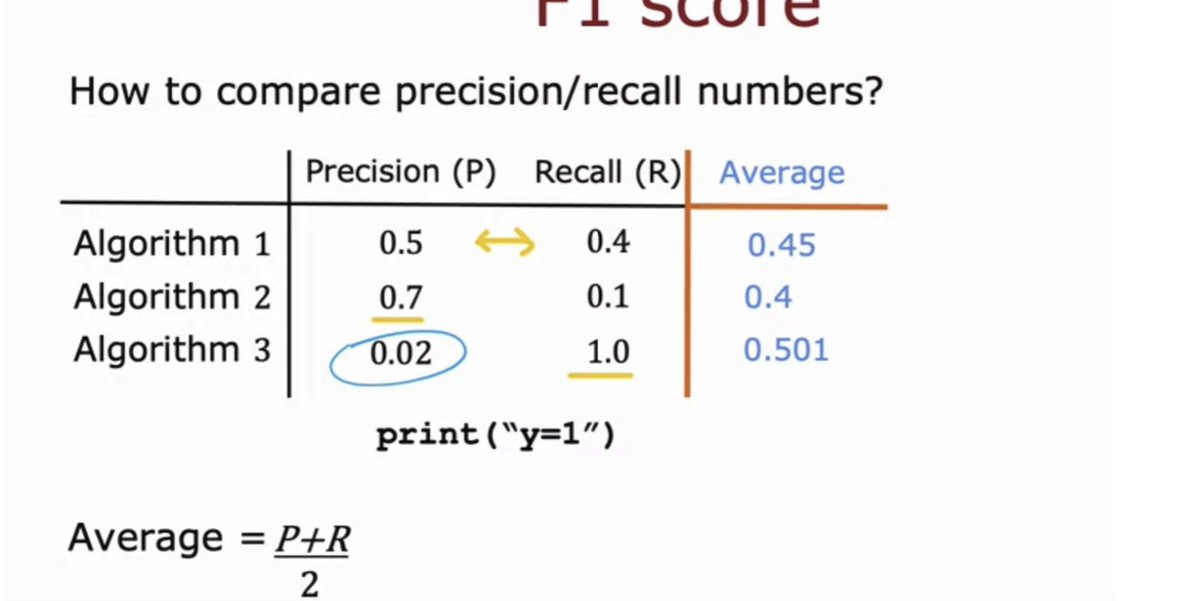
F1 Score:. The F1 score balances Precision and Recall, emphasizing the lower value. Algorithm 1 balances both metrics well. Algorithm 2 favors Precision but loses Recall. Algorithm 3 maximizes Recall but sacrifices Precision. Higher F1 scores indicate better overall performance

0
0
2
Calculate Precision and Recall. TP: 15 (correctly predicted cats). FP: 5 (incorrectly predicted as cats). Precision= TP/(TP+FP) =15/(15+5)=0.75 or 75%. Recall Calculation:. TP: 15 (correctly predicted cats). FN: 10 (missed cats). Recall=TP/ (TP + FN)=15/(15+10)=0.6 or 60%

0
0
1
Recall:.Measures "Of actual positives, how many were correctly predicted?".Focuses on avoiding False Negatives. High Recall: Identifies most positives, even if some False Positives occur. Critical when missing positives is costly (e.g., cancer detection, fraud identification).

0
0
1
Precision:.Measures "Of predicted positives, how many are actually positive?".Focuses on avoiding False Positives. High Precision: Model predicts positive only when confident. Important when False Positives are costly (e.g., spam detection, medical diagnosis).

0
0
1
Accuracy:. Measures overall correctness: "What proportion of predictions were correct?".Works well for balanced datasets but can mislead in skewed datasets. Best used when False Positives and False Negatives have similar costs.

0
0
1
When to Add More Training Data. If a model has high variance, adding more data is often helpful because it allows the model to generalize better. If a model has high bias, adding more data will not help. Instead, increase the model complexity.
0
0
1
Regularization:. Prevents overfitting by penalizing large coefficients:. - L1 adds λ∑∣w∣.- L2 adds λ∑w^2. Regularization Strength:.High λ: Reduces overfitting, risks underfitting (high bias). Low λ: Fits data better, risks overfitting (high variance).

0
0
1
Diagnosing Bias and Variance:. High Bias: Both training error J_train and validation error J_cv are high, and J_train ≈ J_cv. High Variance: Training error J_train is low, but validation error J_cv is high. Ideal: Both J_train and J_cv are low, with J_cv ≈ J_train.

0
0
1