

Andrey Vinitsky
@andreyvinitsky
Followers
384
Following
1K
Media
36
Statuses
468
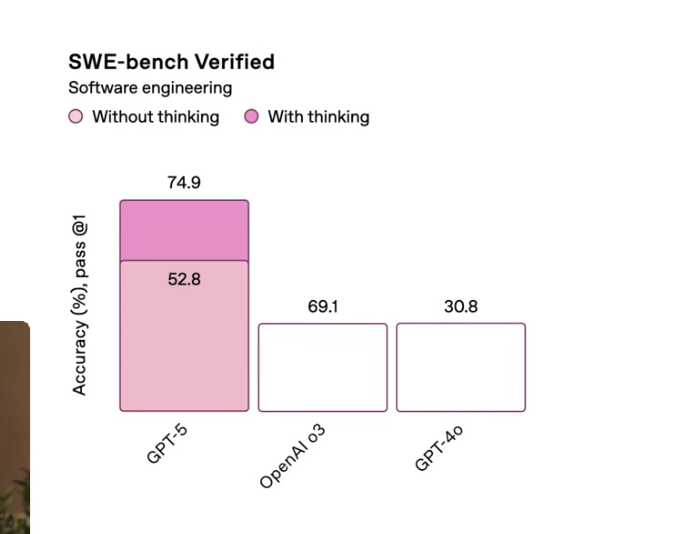
OpenAI needs Graphy 👀.

1
0
4
We made it into the @ProductHunt newsletter today. They called it “RIP spreadsheets” and I love it 😆

1
1
6

Generate videos in just a few seconds. Try Grok Imagine, free for a limited time.
482
230
3K
RT @GraphyHQ: Graphy 3.0 is live 🎉. Turn a messy spreadsheet into a clean, insightful graph that tells a story in seconds. .
0
2
0
We have a new problem at @GraphyHQ . Our customers are creating too much content, and their workspaces are a mess (100+ graphs), it’s hard to find and organize stuff. We’re working on a solution, and here’s a quick preview. What do you think?

1
1
5
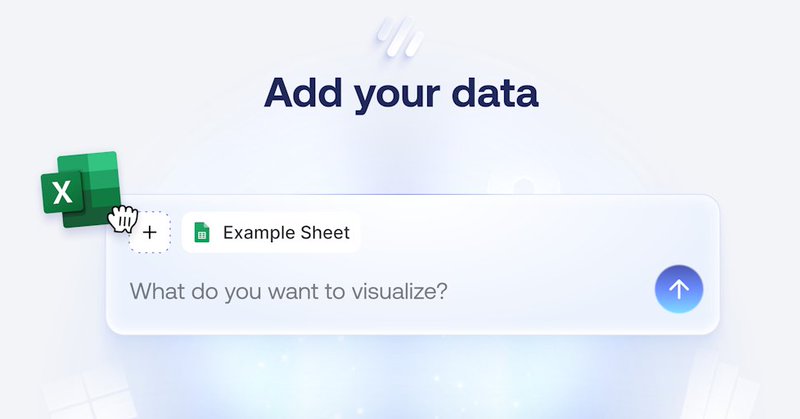
We’ve been way too quiet about what we’ve been working on at @GraphyHQ . 10 seconds. 2 clicks. From a messy CSV to a graph your team will actually read.
2
2
9
No One: Absolutely No One: Stakeholders: Let’s Add a Dashboard.
0
0
3
Founder dinners in 2022:.“How much have you raised?”.“How big is your team?”. Founder dinners in 2025:.“What’s your revenue per FTE?”.
0
0
1
Instead of dumping data, guide your audience. Instead of forcing them to search for meaning, show it to them. The best charts are clear, one insight you can take away and act on.
0
0
0
In reality, colors should emphasize the insight that matters most. 🔴 Too much color = Visual overload.🔵 One clear highlight = A powerful message. Bad analysts overload their charts with too many colors. Good analysts make the key takeaway stand out.
1
0
0
More colors ≠ better charts. Most of us love adding too many colors to our visualizations, thinking it makes the data more engaging.

1
1
3
🚀 There's a lot of talk about why Europe is "behind" the U.S. in the tech ecosystem. This chart shows a stark contrast: 59% of Europeans take 21+ days off, while only 13% of Americans do. Does time off impact the success of a tech ecosystem?

0
0
1
RT @GraphyHQ: Announcing Graphy AI ✨. Creating graphs can be:.😡 Overwhelming.⏱️ Time-consuming.😤 Complex, requiring specialized knowledge….
0
1
0
RT @ChMurphy: Go team @GraphyHQ & 👑 @andreyvinitsky 📈🚀.Graphy AI: Turn your data into stories with AI by @andrewcr77.
producthunt.com
At Graphy we’re on a mission to give everyone data superpowers, our goal is to build the easiest to use and most collaborative data visualization platform on the market.
0
2
0
RT @mayuresh_patole: This is @GraphyHQ being used to visualise data in Chronicle and it is hands down the best ways to create simple, good….
0
2
0
RT @rjgilbert: The 3rd edition of @h1gallery just went out to 687 subscribers. Featuring direct quotes and thinking from the key makers beh….
0
3
0
RT @GraphyHQ: Your graphs just got a lot prettier!. 🚀 We’ve just launched neon themes! Now, you can liven up your data story with electric,….
0
1
0
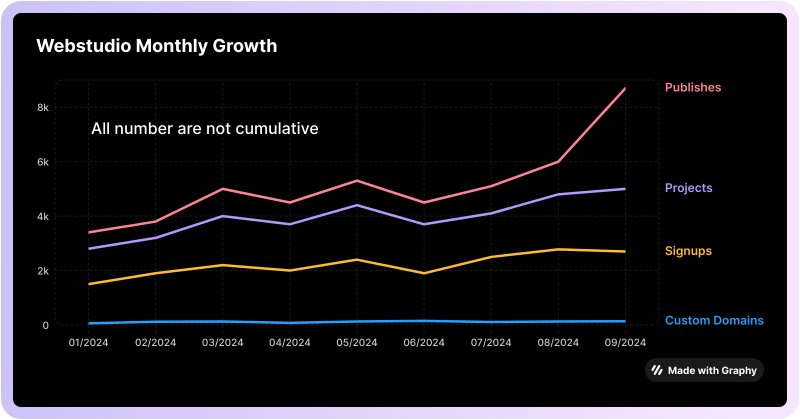
RT @getwebstudio: Webstudio is growing!. Just in September. - 9k publishes this month.- 5k new projects created.- 2.7k signups.- 140 custom….
visualize.graphy.app
Powered by Graphy
0
3
0