
Zebra BI
@ZebraBI
Followers
5K
Following
3K
Media
2K
Statuses
4K
The most powerful and intuitive #datavisualisation technology for Microsoft's #PowerBI, #Excel, and #PowerPoint!
Ljubljana, Slovenia
Joined January 2014
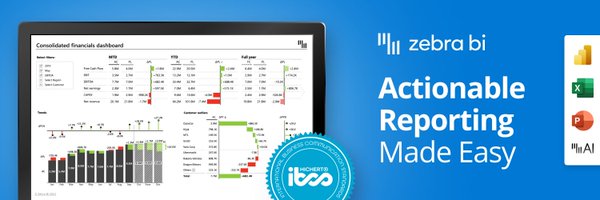
✨ Day 11 of 12 Days to Clarity ✨ Consistency breeds trust. If red means “bad” on page 1, it shouldn’t mean “expense” on page 2. Today’s upgrade: #IBCS-style notation and smart defaults. 🎁 Watch the mini-lesson + download the PBIX template:
zebrabi.com
Get short videos plus free templates for Sales, P&L, HR, and Variance Analysis so you can build clearer, decision-ready reports in 2026.
0
0
0
✨ Day 10 of 12 Days to Clarity ✨ Today’s upgrade: dynamic labels. Titles, headers and legends update with slicers so there’s zero ambiguity about what people are looking at. 🎁 Watch the mini-lesson + download the PBIX template:
zebrabi.com
Get short videos plus free templates for Sales, P&L, HR, and Variance Analysis so you can build clearer, decision-ready reports in 2026.
0
0
1
Day 9 of #12DaysToClarity 🌍 12 regions, 12 separate charts? No. Today: small multiples to compare regions/products in one consistent grid. 🎁 Watch + get the PBIX template: https://t.co/gWUgm6Bp63
#PowerBI #DataViz #ZebraBI
0
1
2

With smart policies, we can continue to expand American recycling to meet the demand for products made with recycled plastic while keeping the U.S. competitive. Find out more.
0
3
29
Day 8 of #12DaysToClarity 📊 The P&L is critical—but it shouldn’t be painful to read. Today: a modern income statement with waterfalls, clean subtotals & clear structure. 🎁 PBIX Template + walkthrough: https://t.co/vN7d2baSbz
#PowerBI #Finance #ZebraBI
0
1
3
Day 7 of #12DaysToClarity 🎯 Showing 500 products in one chart isn’t detail, it’s noise. Today: Top N + Others to highlight the real drivers. 🎁 Watch + download the PBIX template: https://t.co/ysI6LDUBrv
#PowerBI #ZebraBI #DataAnalytics #DataViz
0
0
0
Day 6 of #12DaysToClarity 📱 Your dashboard looks great on your monitor—but on your CEO’s phone? Today: responsive reports that stay readable on any screen. 🎁 Mini-lesson + PBIX template: https://t.co/mZVoXWTRSM
#PowerBI #DataViz #ZebraBI
0
0
1

🔵 Dreamcash is now live! Trade digital markets 24/7 with 40x leverage. Seamlessly trade everything from Bitcoin, Ethereum, XRP and 100+ other cryptocurrency to NVIDIA, GOOGL and AAPL. Fast. Simple. Addictive. Fun.
0
25
578
Day 5 of #12DaysToClarity 💬 “Why is revenue down?” shouldn’t start an email thread. Today: dynamic comments that filter with the data, right on the visual. 🎁 Watch + get the PBIX template: https://t.co/clY83eMwHs
#PowerBI #DataStorytelling #ZebraBI
0
0
1
Day 4 of #12DaysToClarity 🛠️ Still writing custom DAX for every variance? Today: automatic variances for Actual vs Budget vs Forecast, visualized out of the box. 🎁 Mini-lesson + template: https://t.co/dpFrEiuxEK
#PowerBI #ZebraBI
zebrabi.com
Get short videos plus free templates for Sales, P&L, HR, and Variance Analysis so you can build clearer, decision-ready reports in 2026.
0
0
0
Day 3 of 12 Days to Clarity ✨ Big KPI cards tell you what happened, not if it’s good. Today: KPI cards with context—trend + variance in one tile. 🎁 Watch + download the PBIX template: https://t.co/fcgzkMgJe6
#PowerBI #DataViz #ZebraBI #12DaysToClarity
0
0
0
Day 2 of #12DaysToClarity 🚀 The Chart Slider lets you: • Switch waterfall/column/line in a single visual • Serve Finance, Sales & Management • Cut duplicate report pages Link to template + mini-lesson in the next tweet 👇 #PowerBI #DataViz #ZebraBI
1
0
1

Our CRM was built for businesses that want to grow smarter.🌱 Automate tasks, manage leads, and close more deals!
15
25
520
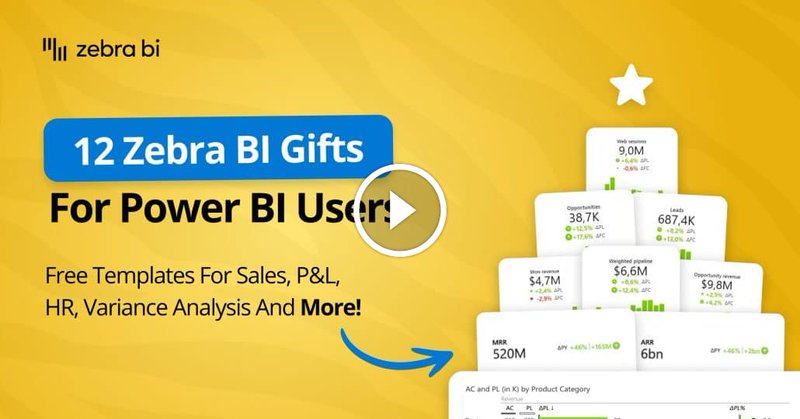
Day 1 of our 12-day Zebra BI Power BI series is live! 🎉 Learn how to turn dense HR/Sales/Finance Tables into insight-first views with built-in variances and embedded charts. Watch + template 👉 https://t.co/8oqQswjG5q
#PowerBI #DataAnalytics #ZebraBI
0
1
1
Still rebuilding the same reports every month? Month-end FP&A shouldn’t be a marathon. See how AI can help. Join us live on Dec 16, 6 pm CET with our Founder & CEO @lapajne. Register here: https://t.co/UvaFt3tV6y
#FinancialReporting #FinanceAutomation #ZebraAI
0
1
1
Stop explaining numbers. Start making decisions. Join us live today at 18:00 CET. Free to register. 👉 https://t.co/EoQQQcUajn
#SalesDashboard #PowerBI #Webinar #ZebraBI
0
0
0
If your first reaction to a slow Power BI report is "that's just how it is," let's talk. Your report isn't the problem. The data model is. We built a practical checklist to help you fix oversized tables and heavy DAX without breaking everything. Make it fast:
0
0
1

🚨 VICE Magazine Is Back! 2025 marks the glorious return of VICE magazine to print, marking a new golden era of weird and wonderful reportage in a totally messed-up world. Subscribe today from $2/mo.
0
37
521
BI leaders know this problem: you have the data and expertise, but no shared visual language. Oliver Schaerer at Delica solved it with IBCS + Zebra BI. Now 2,000 employees speak the same data language and other companies are following their lead. https://t.co/Ld1LgFFOIp
0
0
5
Your sales dashboard is your credibility. On Dec 3, 18:00 CET, learn how to build one that leaders trust. 👉 Free webinar: https://t.co/yBGpjy17jK
#ZebraBI #SalesDashboard #DataDriven #PowerBI
0
0
0
New in Zebra BI Charts: dynamic legends 🥳 Your Power BI dashboards finally keep the story straight. Legends update automatically when you change plans, forecasts or years. No more “wait, what am I looking at?” Read the full update: https://t.co/xX9rSbWGgP Fewer mistakes.
0
0
1

Phantom Blade Zero launches worldwide on September 9, 2026 on Steam, PlayStation, and the Epic Games Store. Join the journey and wishlist today to stay connected!
0
9
94
From messy spreadsheets to automated, IBCS-ready insights in seconds. Join @lapajne at the 13th International Controlling Conference to see AI in controlling in action. On Nov 21, 3 pm! Sign up here: https://t.co/xUrs3iXULx
#AIinControlling #ZebraAI #ICCC2025
1
1
1