

USGS Data Science
@USGS_DataSci
Followers
10K
Following
2K
Media
449
Statuses
2K
Featuring @USGS #dataScience and #DataViz
Joined August 2015
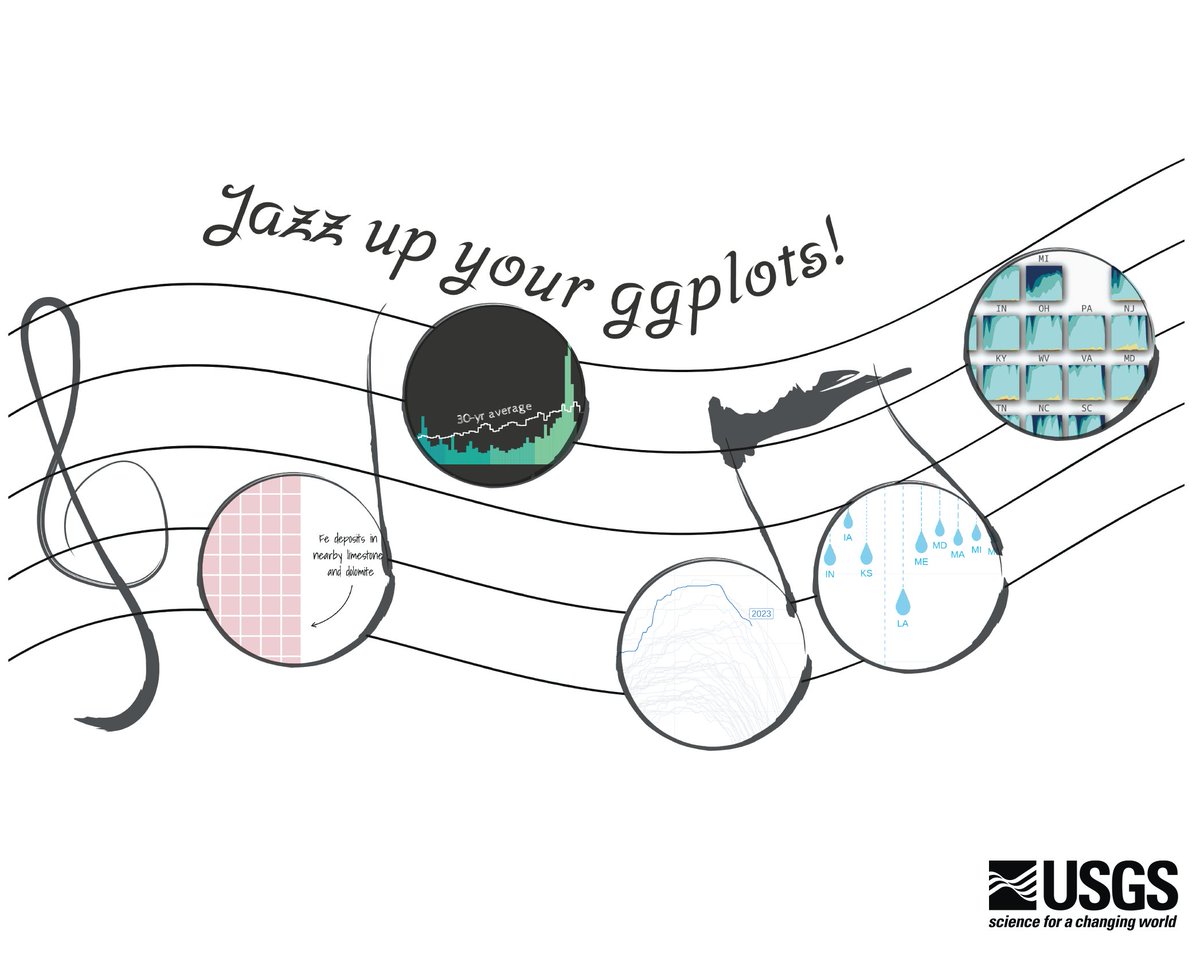
Looking for ways to jazz up your ggplots? 🎷📈. Check out our new blog post that highlights #ggplot extension packages, with #reproducible code, to help elevate your #rstats #DataViz! ⬇️ . #OpenScience #DataScience
1
28
148
@USGS_Water For more water data visualizations, check out our website:
labs.waterdata.usgs.gov
Water data visualizations from the USGS Vizlab
0
0
2
Each tile shows the percent of @USGS_Water streamgages by flow levels, using percentiles relative to the historic record at each site. This tells us if current streamflow conditions are wetter or drier than has been experienced at each site in the past.
1
0
3
May #streamflow conditions across the U.S. 💧 . Wet conditions persisted for much of the Northeast and Mid-Atlantic, while parts of the Southeast and Southwest experienced dry conditions. #DataViz made with #rstats #dataRetrieval

2
2
11
@USGS_Water For more water data visualizations, check out our website:
labs.waterdata.usgs.gov
Water data visualizations from the USGS Vizlab
0
1
3
Each tile shows the percent of @USGS_Water streamgages by flow levels, using percentiles relative to the historic record at each site. This tells us if current streamflow conditions are wetter or drier than has been experienced at each site in the past.
1
1
3
April #streamflow conditions across the U.S. 💧 . Wet conditions persisted in the Midwest and Northeast, while parts of the Southeast and Southwest experienced dry conditions. #DataViz made with #rstats #dataRetrieval.

1
2
5
@USGS This #DataViz summarizes 3 months of hydrologic events, such as #drought conditions in the Southwest, #flooding conditions in parts of the Eastern U.S., and #AtmosphericRivers leading to flooding in the Pacific Northwest.
0
1
3
U.S. River Conditions from January 1, 2025 to March 31, 2025 at @USGS #streamgages 💧. River conditions range from driest conditions at a gage (red open circles) to the wettest (blue closed circles). A purple outer ring indicates flooding. . #rstats
1
3
9
@USGS_Water For more water data visualizations, check out our website:
labs.waterdata.usgs.gov
Water data visualizations from the USGS Vizlab
0
0
1
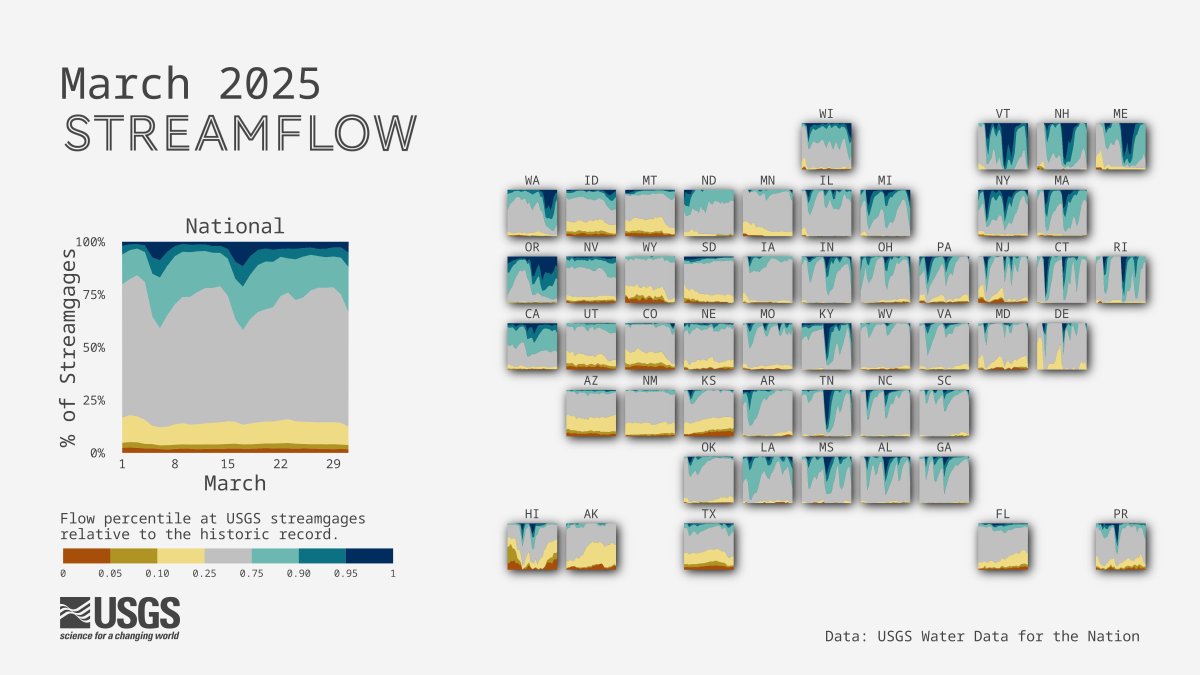
Each tile shows the percent of @USGS_Water streamgages by flow levels, using percentiles relative to the historic record at each site. This tells us if current streamflow conditions are wetter or drier than has been experienced at each site in the past.
1
0
1
March #streamflow conditions across the U.S. 💧 . Wet conditions dominated much of the West Coast and Northeast, while near normal conditions persisted for much of the Central U.S. #DataViz made with #rstats #dataRetrieval.
2
1
5
@USGS_Water For more water data visualizations, check out our website:
labs.waterdata.usgs.gov
Water data visualizations from the USGS Vizlab
0
1
2
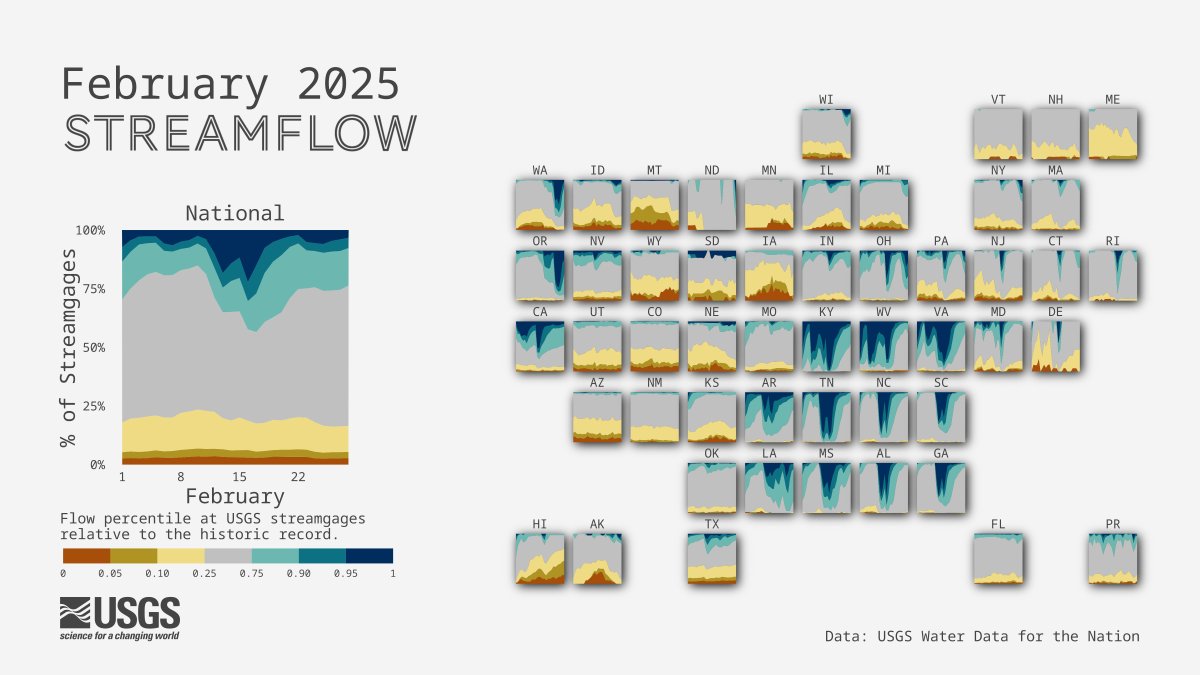
Each tile shows the percent of @USGS_Water streamgages by flow levels, using percentiles relative to the historic record at each site. This tells us if current streamflow conditions are wetter or drier than has been experienced at each site in the past.
1
0
2
February #streamflow conditions across the U.S. 💧 . Winter storms brought wet conditions to much of the Southeast, while parts of the Northern Rockies saw dry conditions. #DataViz made with #rstats #dataRetrieval
1
2
4
@USGS_Water For more water data visualizations, check out our website:
labs.waterdata.usgs.gov
Water data visualizations from the USGS Vizlab
0
0
1
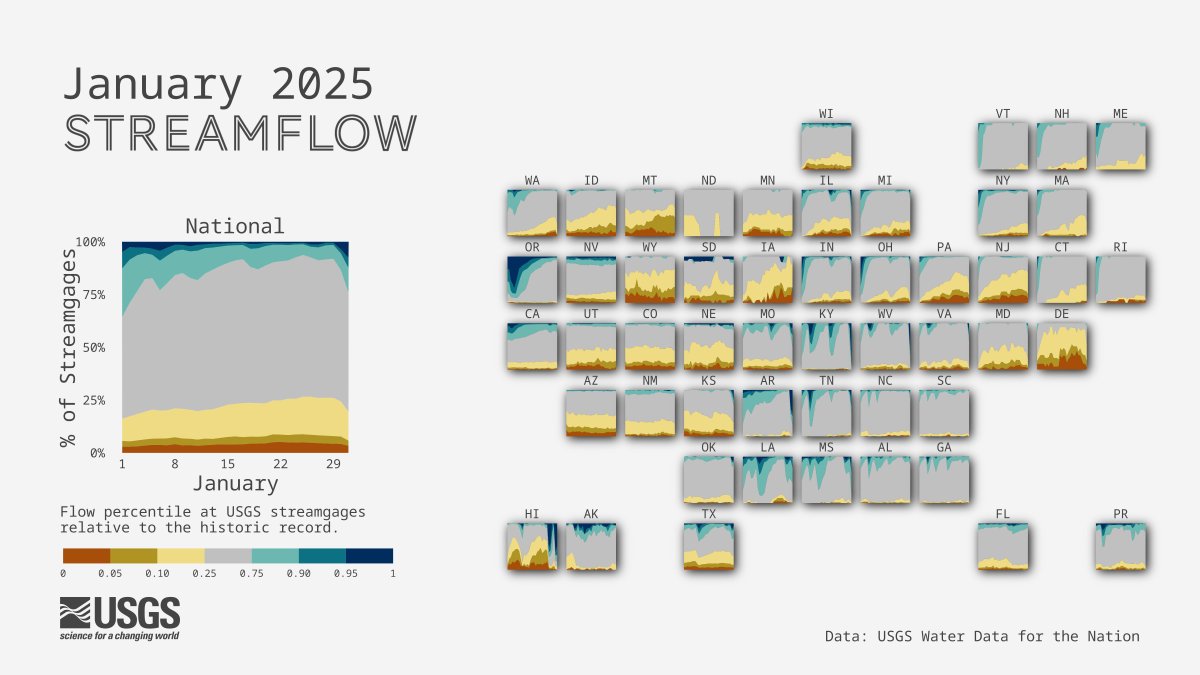
Each tile shows the percent of @USGS_Water streamgages by flow levels, using percentiles relative to the historic record at each site. This tells us if current streamflow conditions are wetter or drier than has been experienced at each site in the past.
1
0
1
January #streamflow conditions across the U.S. 💧 . Dry conditions persisted for much of the Southwestern U.S. while winter storms brought wet conditions to parts of the Southeast and Northwest. #DataViz made with #rstats #dataRetrieval .
1
3
3
This #DataViz summarizes 3 months of hydrologic events, such as #drought conditions across many parts of the U.S. with #flooding conditions due to #HurricaneHelene and #HurricaneMilton for much of the Southeastern U.S.
0
0
2
U.S. River Conditions from October 1, 2024 to December 31, 2024 at @USGS #streamgages 💧.River conditions range from driest conditions at a gage (red open circles) to the wettest (blue closed circles). A purple outer ring indicates flooding. #rstats
2
4
8