

Stock Twit📈
@Stocktwit_IN
Followers
13,406
Following
1,175
Media
5,455
Statuses
20,318
Market Updates, Experts #TradingView & Threads 🧵 Share with us-Grow with us Mention @Stocktwit_IN for a FREE shoutout📢 Tweets 4 learning
भारत
Joined July 2019
Don't wanna be here?
Send us removal request.
Explore trending content on Musk Viewer
ALL EYES ON RAFAH
• 831023 Tweets
De Niro
• 255498 Tweets
Iggy
• 166142 Tweets
Fernando
• 96681 Tweets
Virginia
• 80507 Tweets
#WWENXT
• 69345 Tweets
Game 5
• 66951 Tweets
Lali
• 61695 Tweets
Thomsen
• 59127 Tweets
#خادم_الحرمين_الشريفين
• 52419 Tweets
Mavs
• 51816 Tweets
DAME MIL FURIAS
• 42091 Tweets
Millonarios
• 39691 Tweets
Renê
• 36651 Tweets
Towns
• 33077 Tweets
Delfina
• 32596 Tweets
Peñarol
• 32087 Tweets
Mika
• 27845 Tweets
Hardy
• 24644 Tweets
Doncic
• 21634 Tweets
Gobert
• 21166 Tweets
Belgrano
• 17736 Tweets
僕のもの
• 17313 Tweets
Jordynne Grace
• 15780 Tweets
Guercio
• 15098 Tweets
Wheeler
• 10048 Tweets


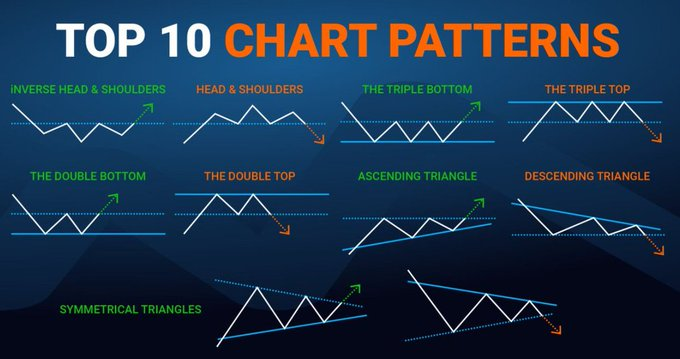
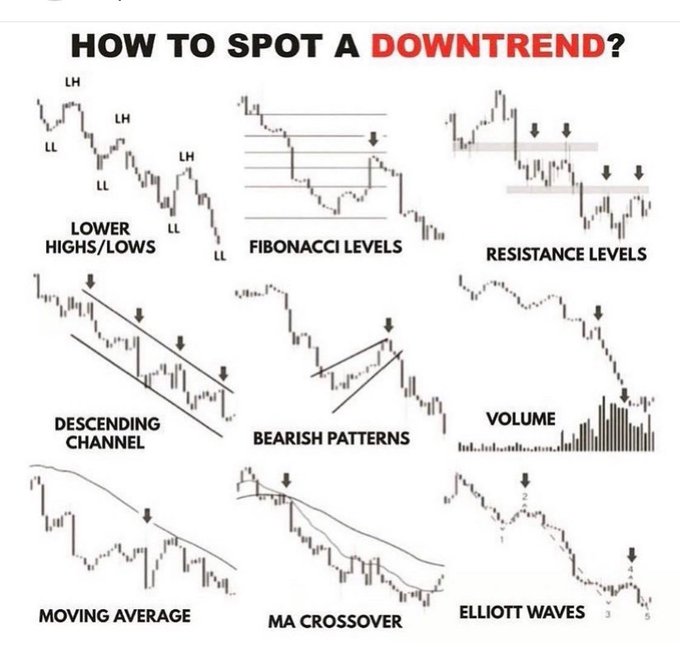
Most Essential Stock Chart Patterns with
@valuelevels
1. Ascending triangle
2. Descending triangle
3. Symmetrical triangle
4. Pennant
5. Flag
6. Wedge
7. Double bottom
8. Double top
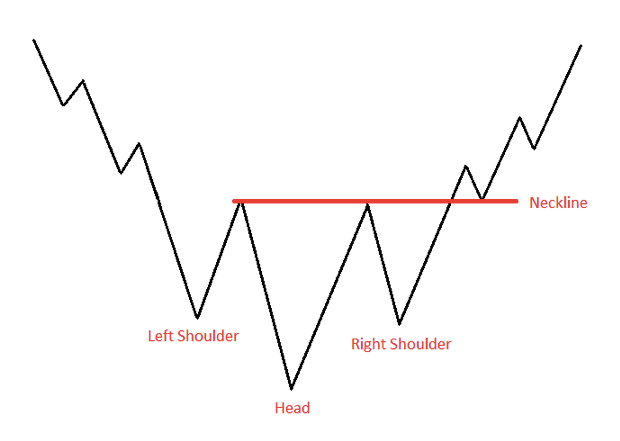
9. Head and shoulders
10. Rounding top or bottom
11. Cup and handle
11
89
259
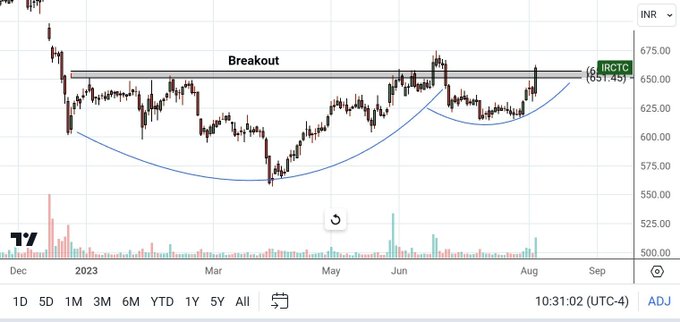
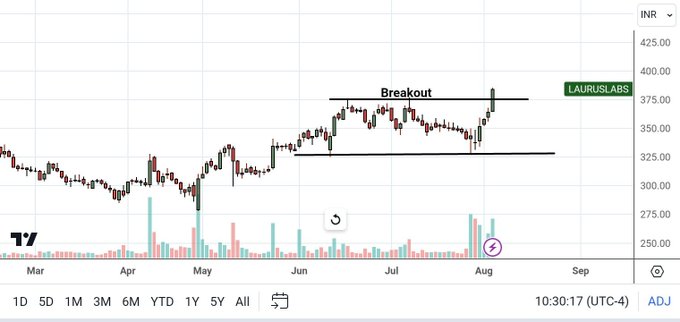
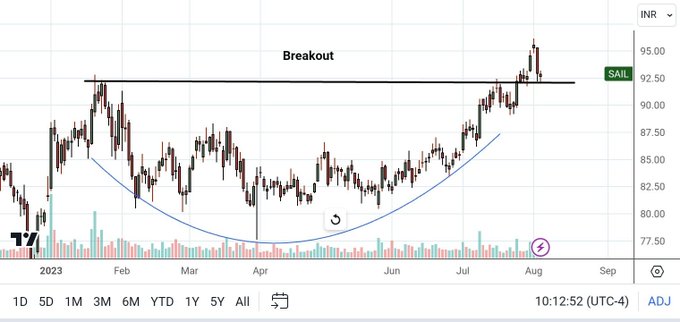
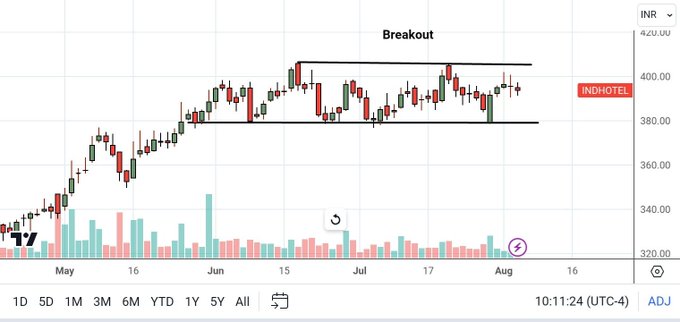
#breakout
#stocks
for friday:
1. Indian hotels
2. Irctc
3. SAIL (retest)
4. Laurus labs
Chart setups by
@nirajtanna
@TechTradesTT
@Breakoutrade94
@BakuSarman
@STOCKBAGGER1
1
19
136
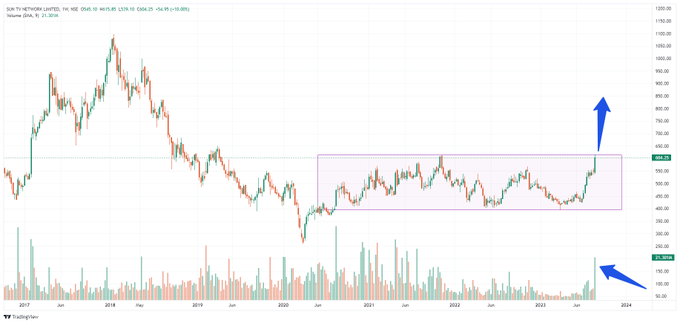
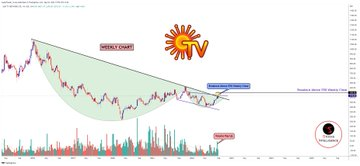
Weekly
#Breakoutsoon
with
@TechTradesTT
Stock No. 3 - SUNTV
More than 3 years of trading range
Entry Above 615-620+
🚦 SL 550
#Like
#Repost
for Next Stock
#tradingview
3
11
87
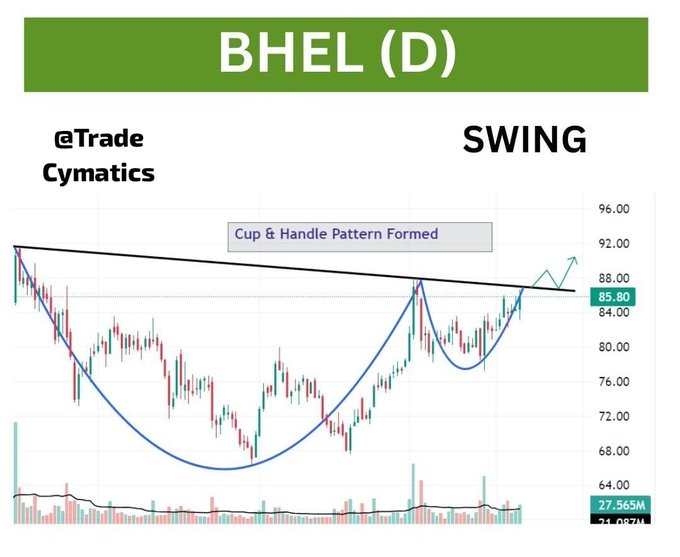
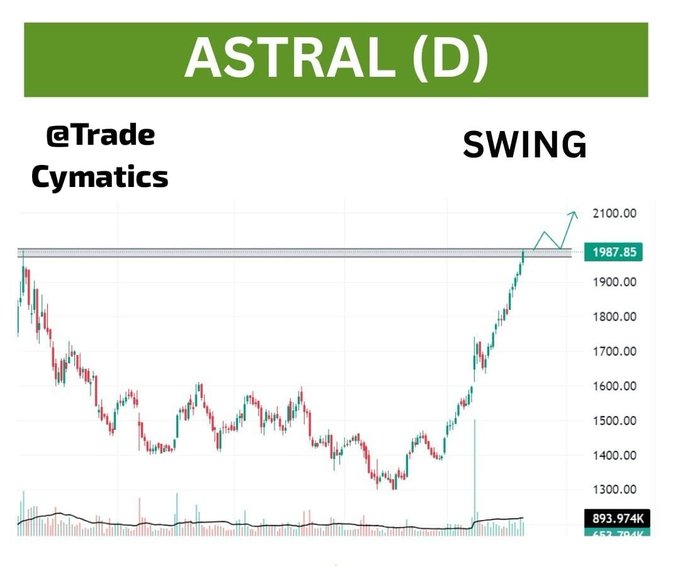
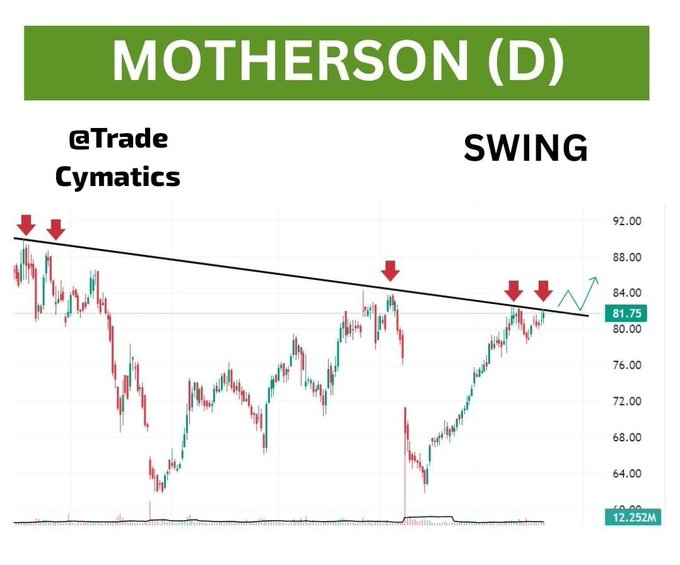
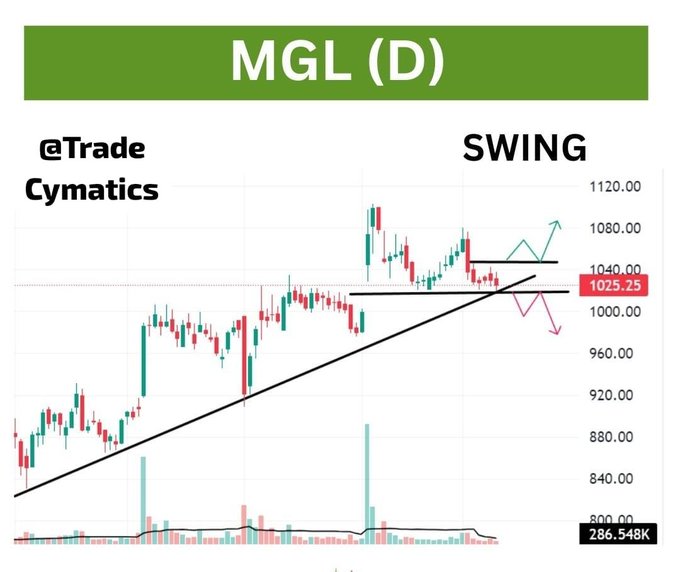
STOCKS FOR MONDAY 🧐
POTENTIAL
#BREAKOUTSTOCKS
#BHEL
#ASTRAL
#MOTHERSON
#MGL
Stock setup by
@TCymatics
#StocksInFocus
2
15
81
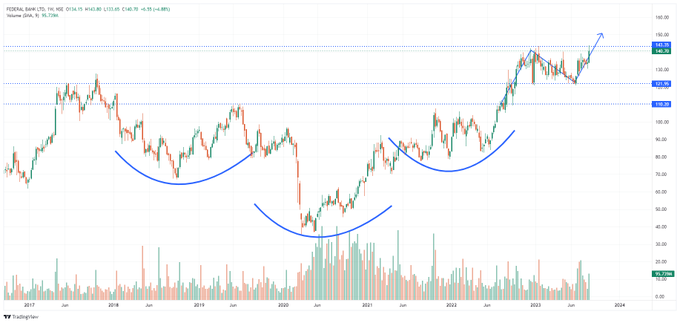
Weekly
#Breakoutsoon
with
@TechTradesTT
Stock No. 4 - FEDERALBNK
HnS Continuation Pattern 📈
Entry Above 145+
🚦 SL 120
#Like
#Repost
for MAX Reach
TELEGRAM Group Link 👇
#tradingview
3
10
81
It takes ₹0 to Like & retweet
#TradingView
#StocksToTrade
#Nifty
#sensex
#stockstowatch
#StockMarket
2
13
73
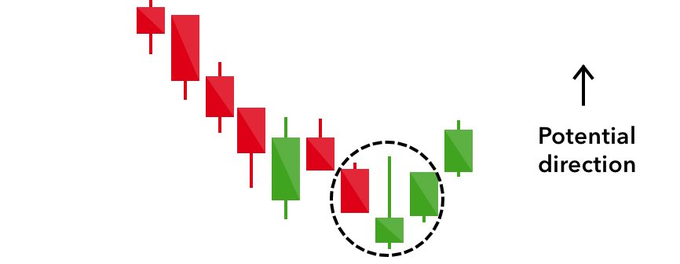
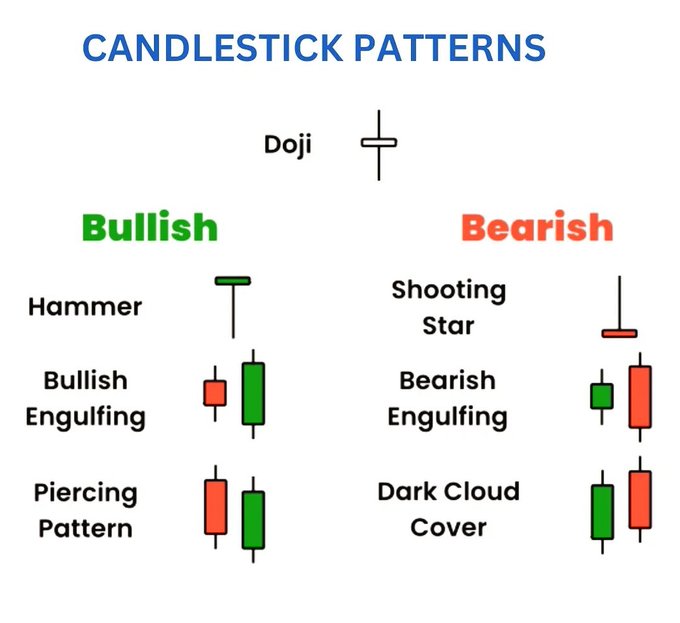
Some Complex candlestick patterns
thread 🧵🧵👇
Candlesticks are graphical representations of price movements for a given period of time. They are commonly formed by the opening, high, low, and closing prices of a financial instrument.
4
44
78
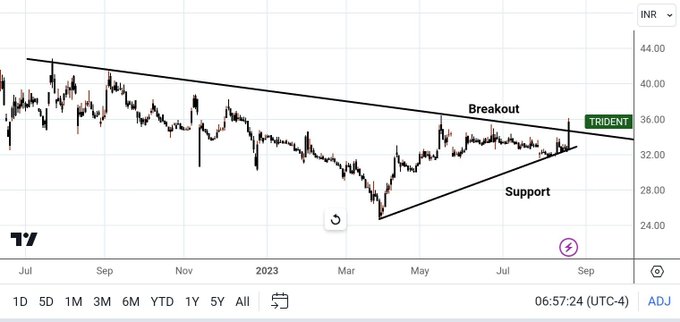
#breakout
#stocks
4 tomorrow
1. Trident
2. S.p.apparels
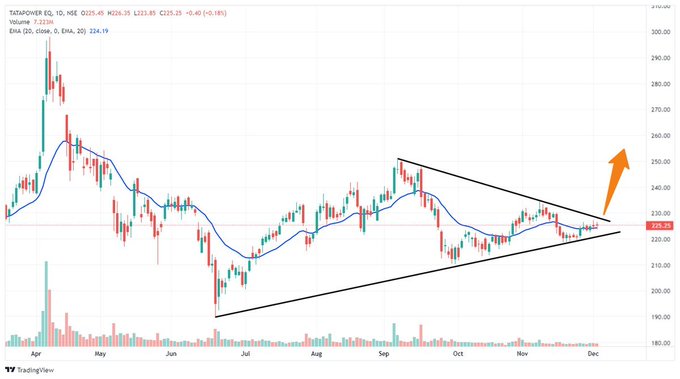
3. Tata power
4. MRPL
Stock ideas by
@nirajtanna
@TechTradesTT
@Breakoutrade94
@BakuSarman
@STOCKBAGGER1

2
11
75
Good Morning Friends
Join StockTwit for Experts Analysis
Learn Something NEW everyday
#TradingView
#TechnicalTrades
#nifty
#niftybank
#StocksToTrade
#stockmarketindia
0
14
70
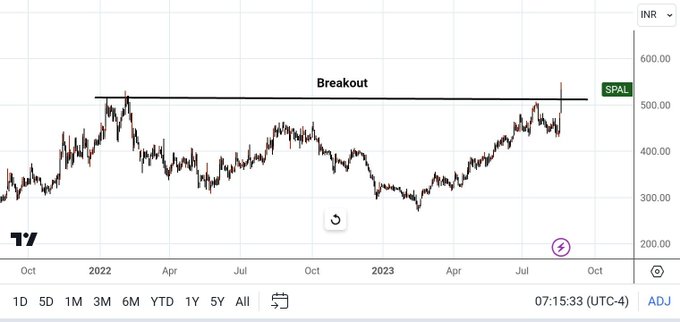
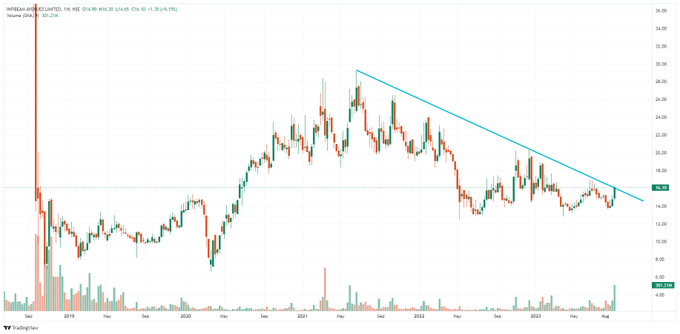
Weekly Stock ideas with Naren Joshi
@TechTradesTT
Stock No. 3
INFIBEAM- Cmp 16
🚦 Weekly Time Frame ready for
#Breakout
🚦 Check Volume
🚦 Buyers can keep a stop loss of 14 for more upside moves.
#Like
#Repost
for Next Stock
TELEGRAM Group Link👇
1
12
70
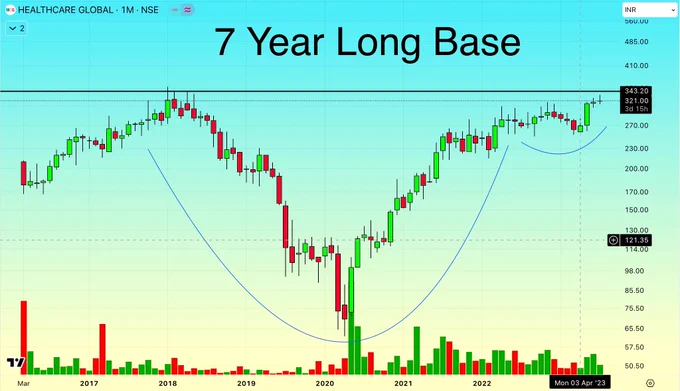
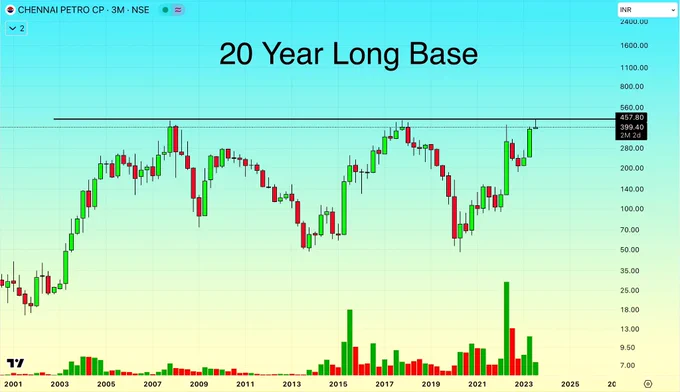
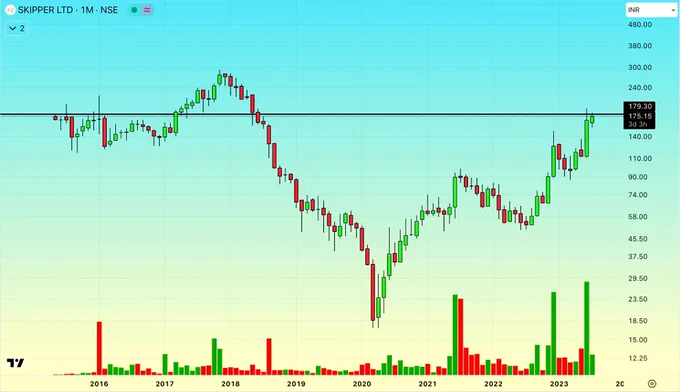
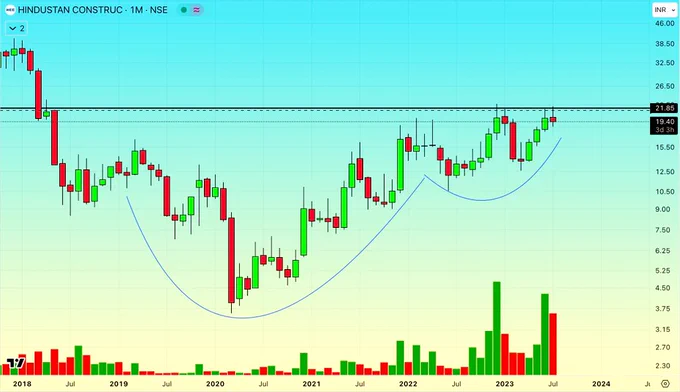
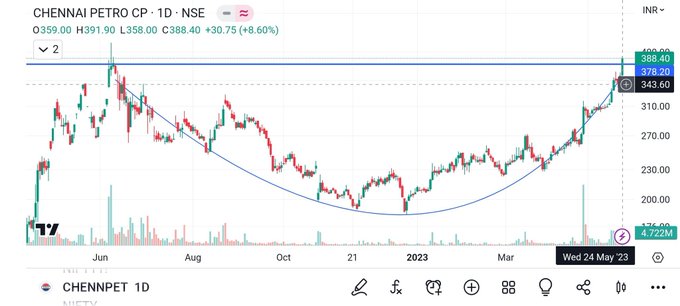
📌Top Stocks Near Multiyear Resistance Zones.
🔹Multiyear Breakouts can Give Multi-bagger Returns💰
1️⃣ Health care Global
2️⃣ Chennai Petroleum
3️⃣ Skipper
4️⃣ Hcc
Stock ideas by
@Trend_trader7
@TechTradesTT
@WaveFinancial
@GarvModi70
@mystock_myview
@Breakoutrade94
3
15
67
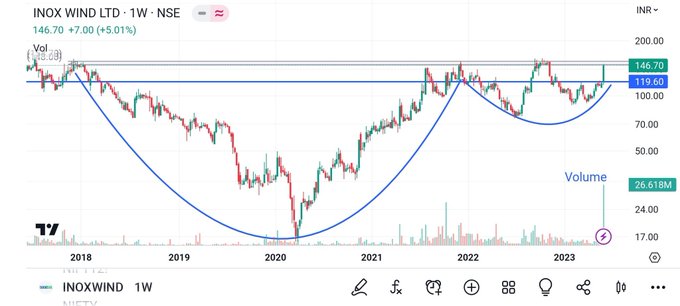
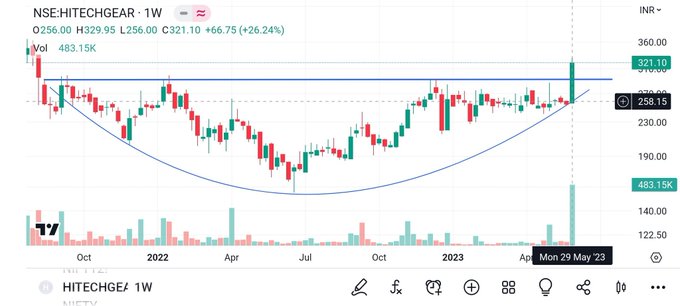
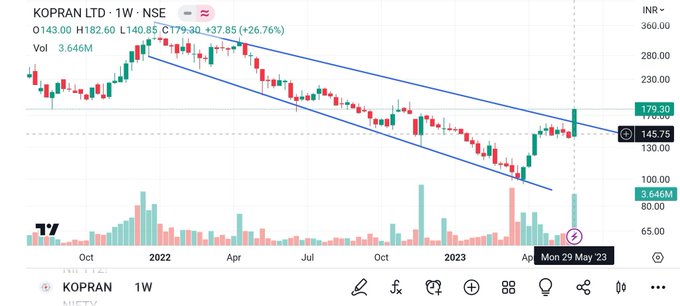
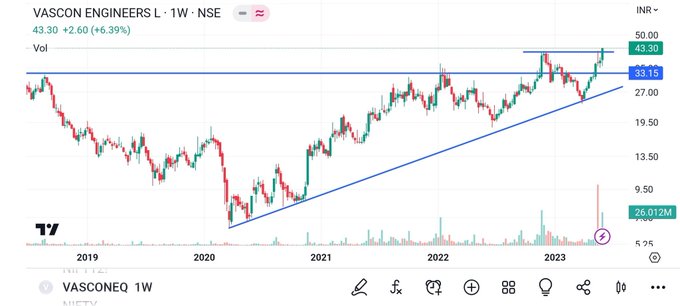
#Weekly
#Breakout
#stocks
1.INOX WIND
2.HI-TECH GEAR
3.KOPRAN
4.VASCON ENG
Chart setups by
@BakuSarman
#TradingView
@GirishAnchanWMA
@RICHADICT
@TechnoChartist
@Addition_Singh
@Niteish_14
@STOCKBAGGER1
2
14
66
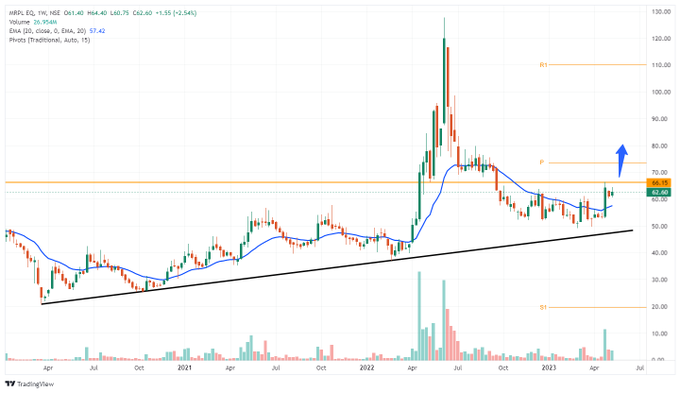
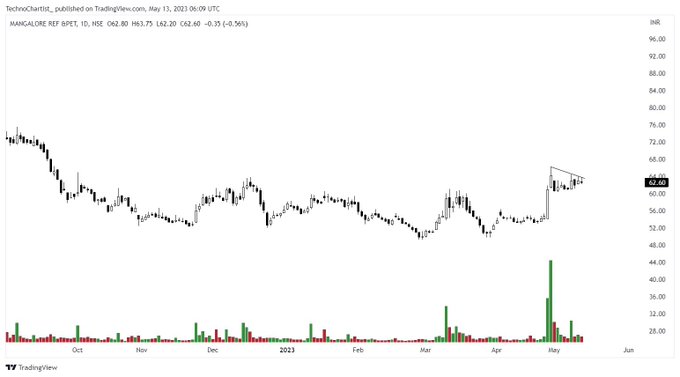
MRPL - Weekly TF
TL support
66+ bullish
#TradingView

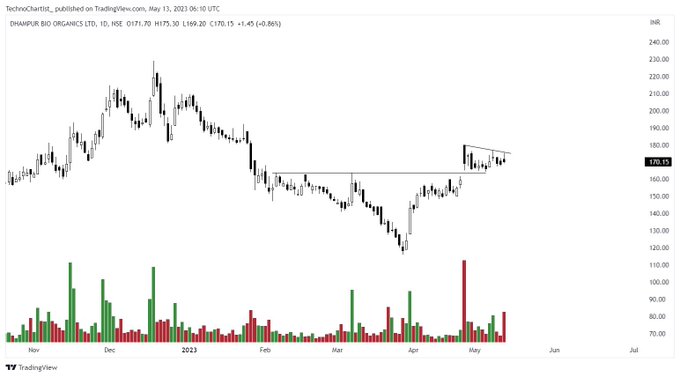
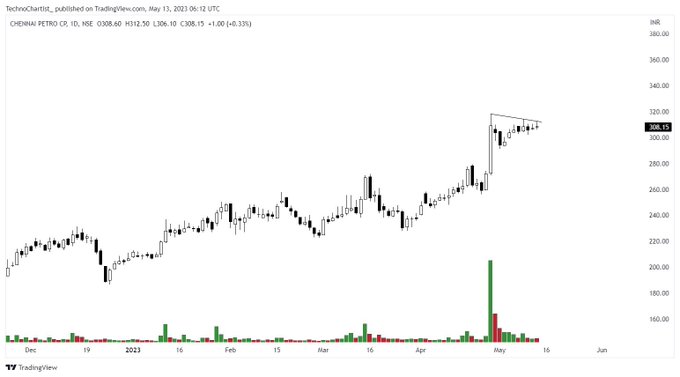
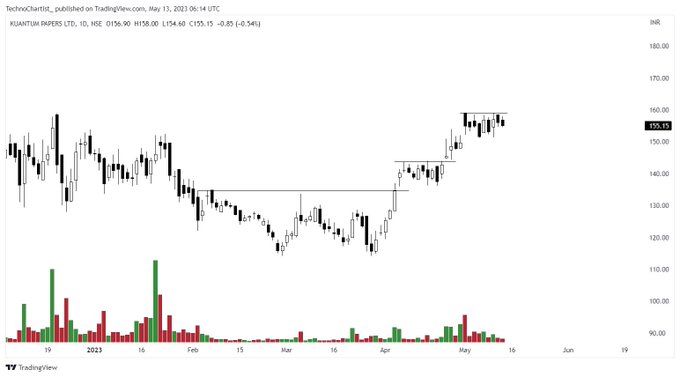
Stocks to watchout!
1 - Dbol
2 - Chennai Petro
3 - Kuantam Papers
4 - Mrpl
@chartmojo
@caniravkaria
@nakulvibhor
@VCPSwing
@Stocksgeeks
@Stocktwit_IN
@StocksNerd
#stocks
2
5
43
1
3
64
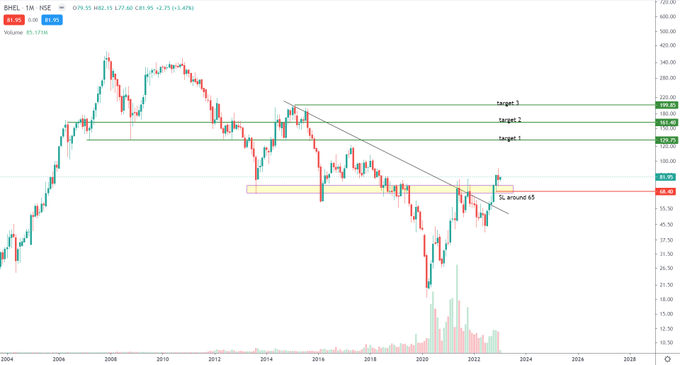
#StocksToBuy
Stock idea from
@amrishmohabey
#BHEL
Can purchase at CMP = 82
SL- Around 65
Target 1- 125-130
Target 2- 158-165
Target 3- 195-200
#TechnicalTrades
#TradingView
2
9
58
Trading Tip:
Less risk = Less emotion
If your feeling fearful then reduce your risk.
Then as confidence grows scale back to your original size.
The Divergent Trader
@TraderDivergent
😃
0
9
56
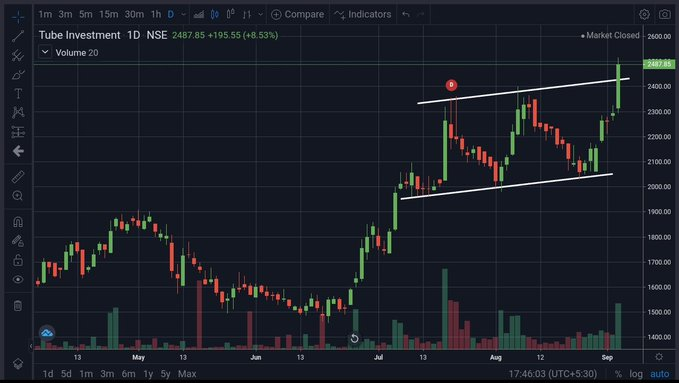
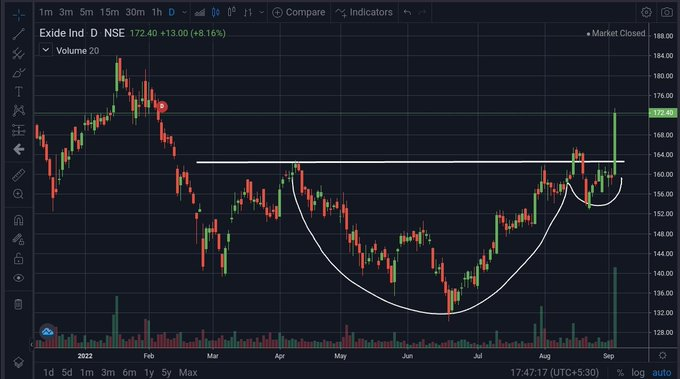
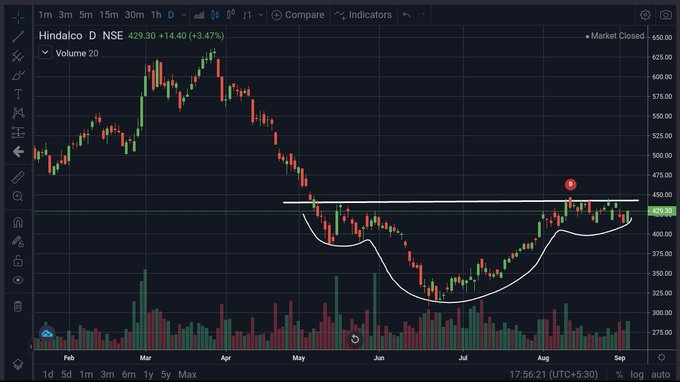
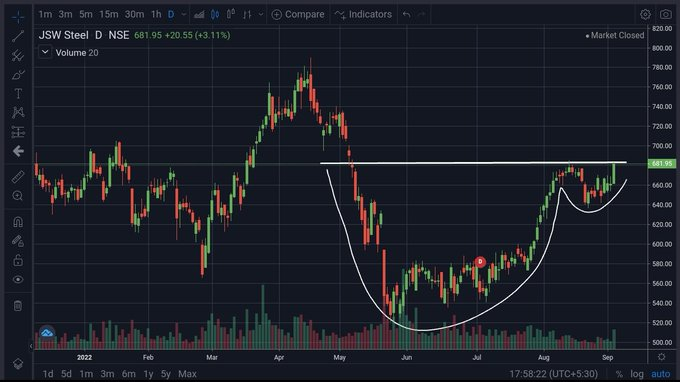
🟢 Stocks To Watch 🟢
Charts analysis with logic from
@Ishan_Narayan_
• Tube Investment (New high)
• Exide (C&H breakout)
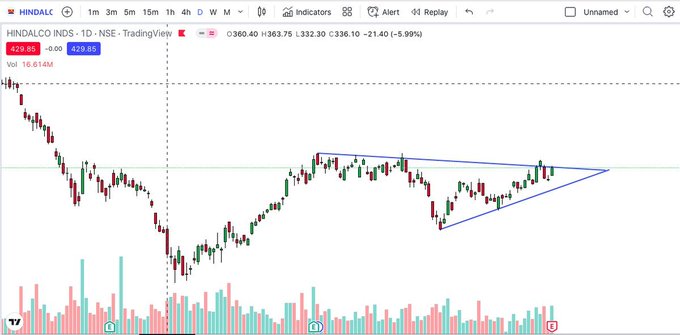
• Hindalco (Inverted H&S)
• JSW Steel (C&H)
very nice... keep sharing bro.
#TechnicalTrades
#TradingView
#StocksToTrade
8
7
53
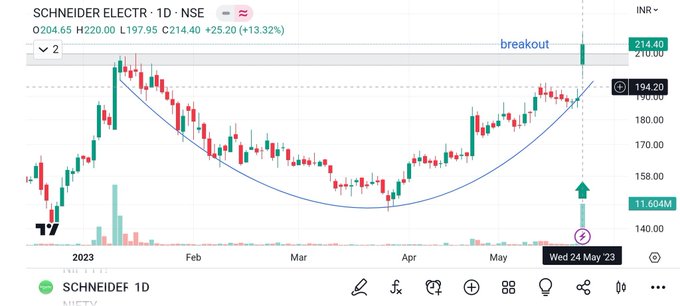
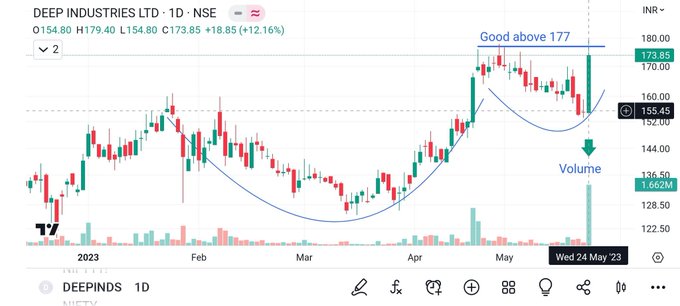
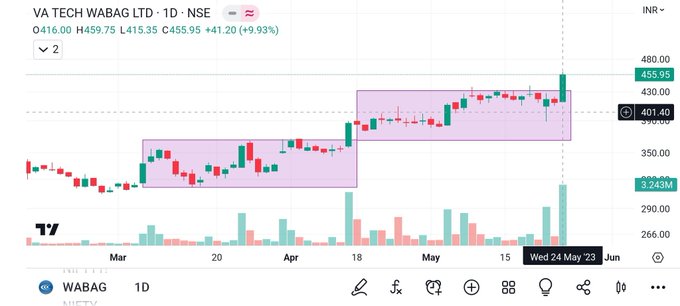
#breakout
#stocks
1.SCHNEIDER
2.DEEP IND
3.WABAG
4.CHENNAI PETRO
👍 Simple & Clear analysis from
@BakuSarman
.. Keep sharing
#trading
#investing
@BakuSarman
@Sumitjain_16
@cakunalshah1983
@TechnoChartist
@STOCKBAGGER1
@Earner_Sanjeev
@ent_wala
@RICHADICT
4
6
55
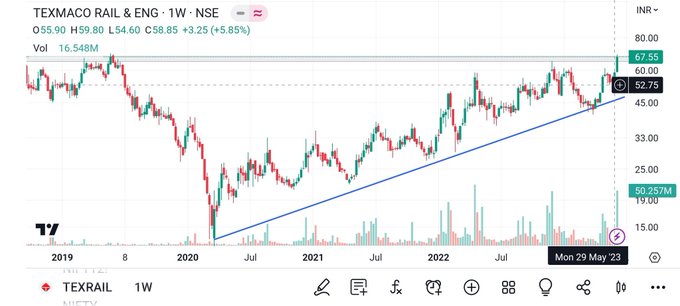
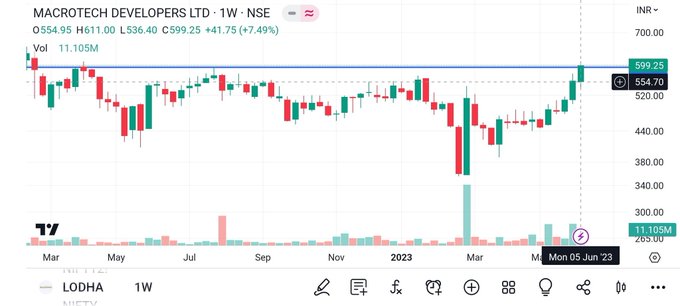
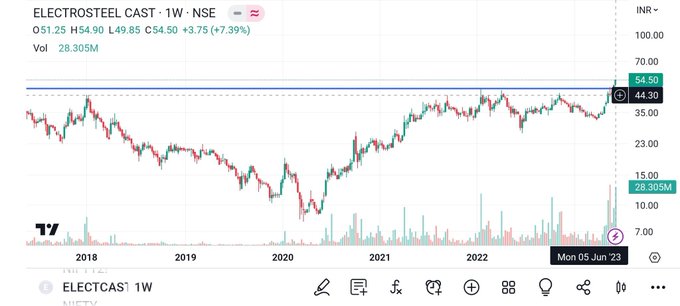
#weekly
#Breakout
#stocks
1.Texmaco
2.Lodha Dev
3.Genus Power
4.Electrosteel
Chart Setups from
@BakuSarman
#trading
#investing

2
5
53
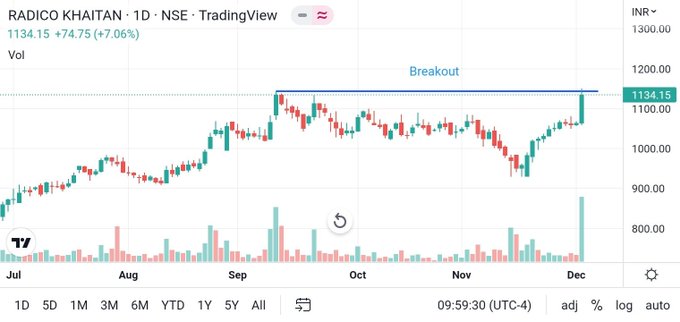
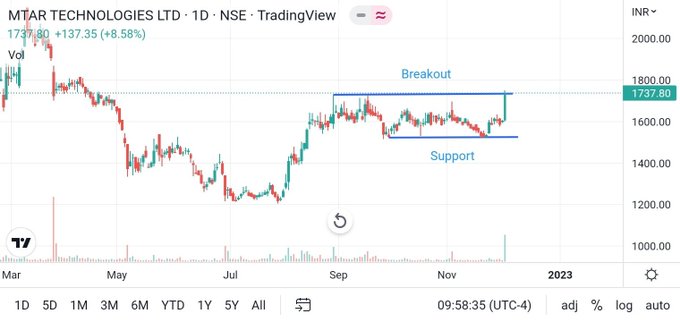
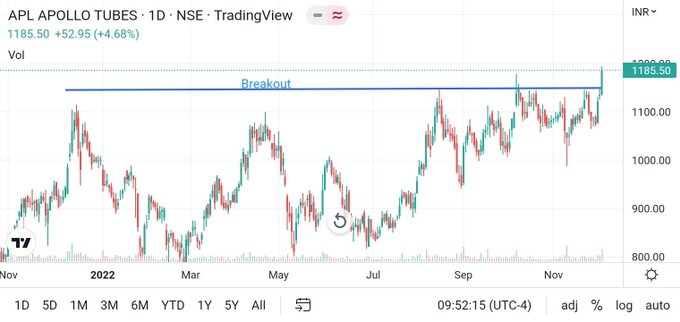
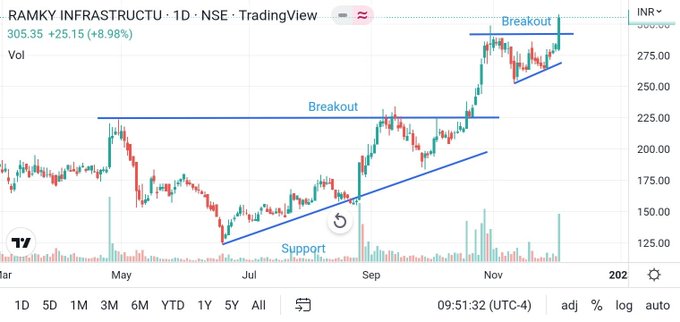
#breakout
#stocks
to watch tomorrow:
1. Apl apollo tubes
2. Ramky infra
3. Radico Khaitan
4. MTAR tech
Like, retweet for More breakout stocks from
@nirajtanna
with
@Stocktwit_IN
#TechnicalTrades
#TradingView
0
11
52
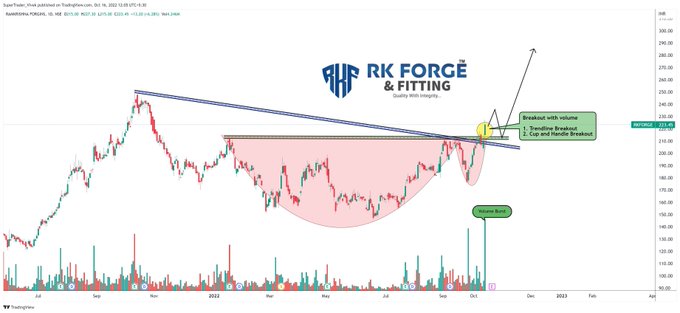
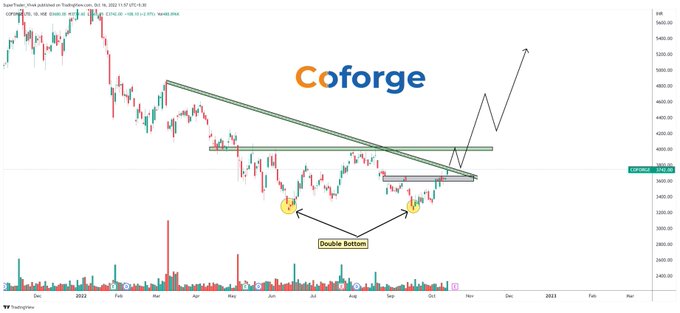
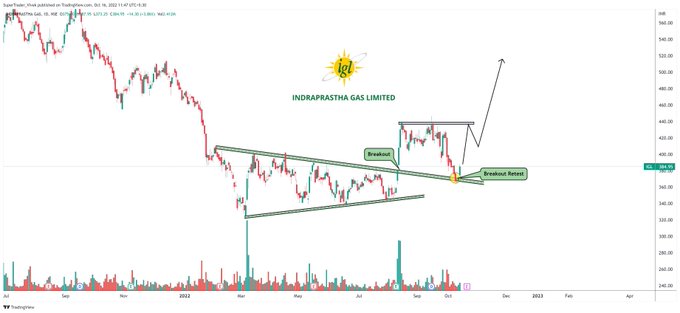
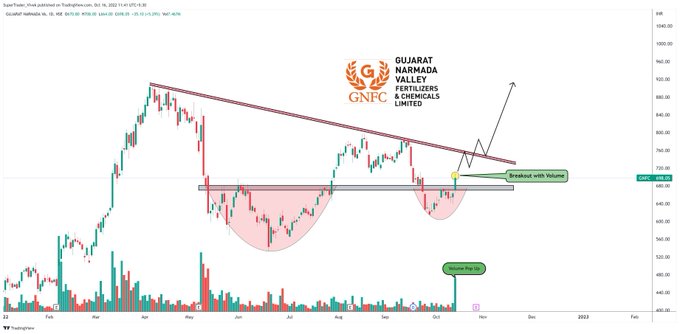
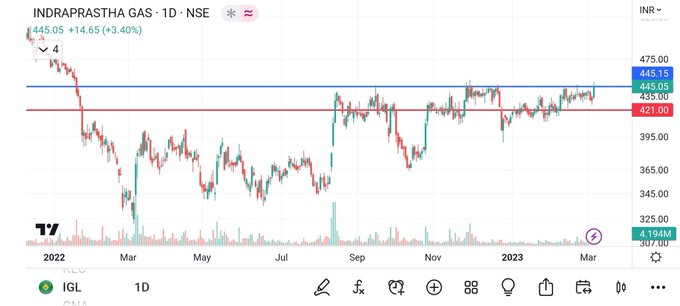
✨
#Breakout
+ Breakout Soon Stocks👇
As shared by
@Tradewith_Vivek
📌RKFORGE
📌COFORGE
📌IGL
📌GNFC
📈Study ="Daily" 📈
Excellent Charts....keep sharing 👌🚀
@chartmojo
@nakulvibhor
@nishkumar1977
@kuttrapali26
@aakankshalovely
2
5
53
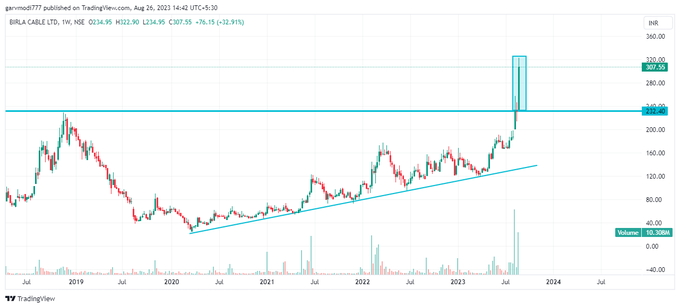
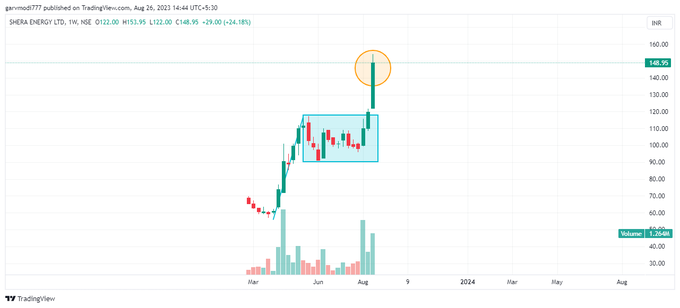
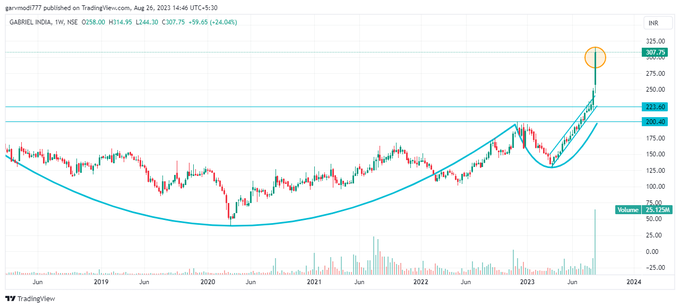
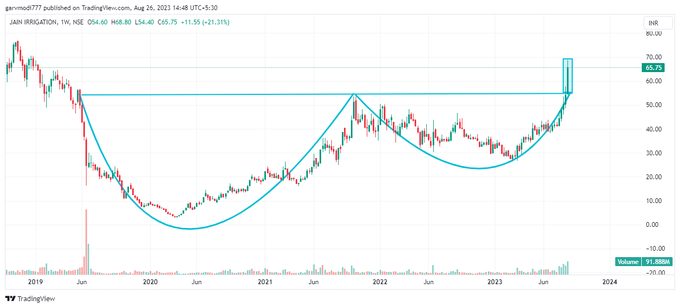
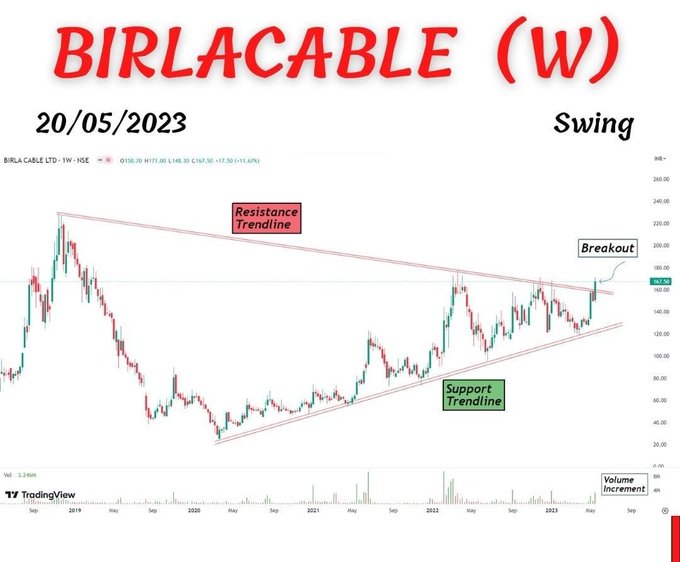
WEEKLY Cash Market
#Breakout
Stocks 🚀🔥
1️⃣ BIRLA CABLE
2️⃣ SHERA ENERGY
3️⃣ GABRIEL
4️⃣ JAIN IRRIGATION
Chart & levels by
@GarvModi70
@WaveFinancial
@mystock_myview
@Ishan_Narayan_
1
4
51
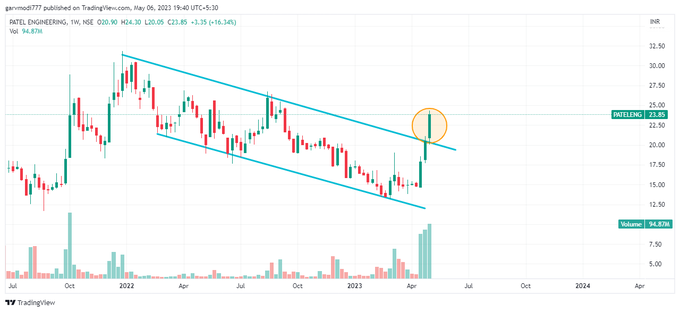
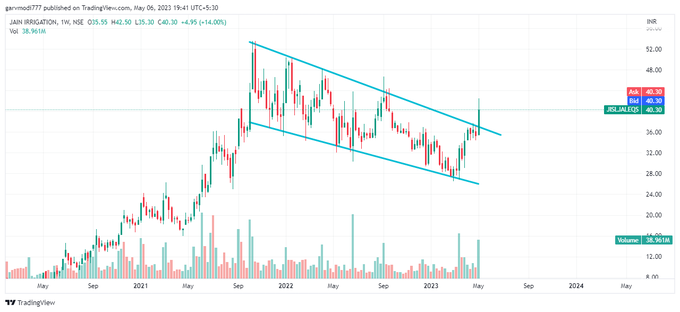
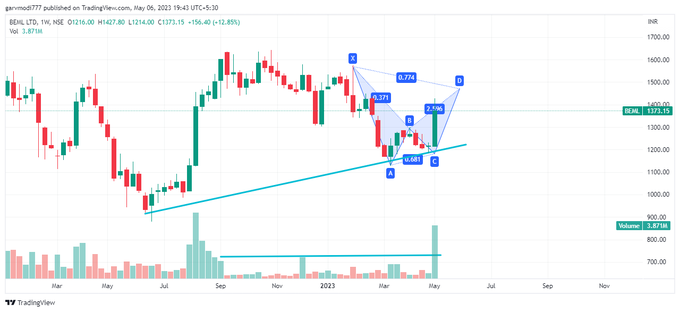
Weekly Cash Market BO Stocks 🚀🔥
1️⃣ ENGINER IND
2️⃣ PATEL ENG
3️⃣ JAIN IRRIGATION
4️⃣ BEML
Stock chart ideas by
@GarvModi70
@techmental_AK
@mystock_myview
@MeghaTrader_MT
@BakuSarman
@Sumitjain_16
@cakunalshah1983
@TechnoChartist

1
7
49
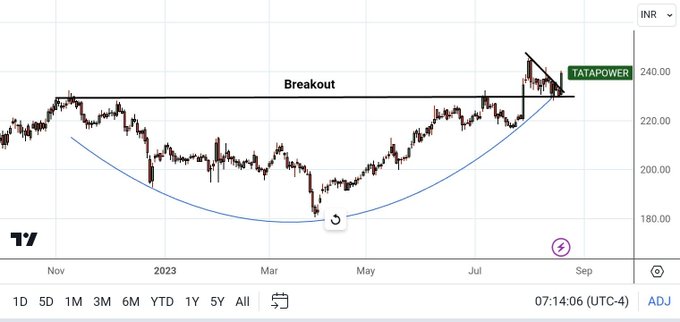
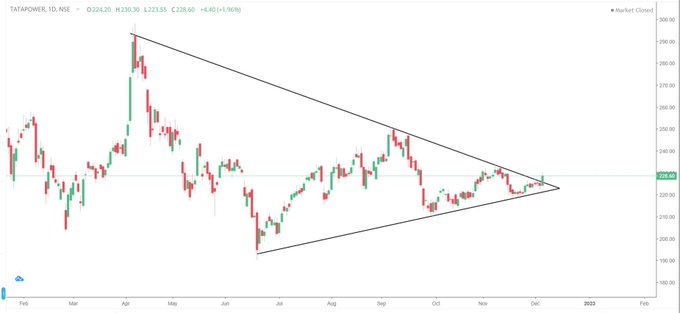
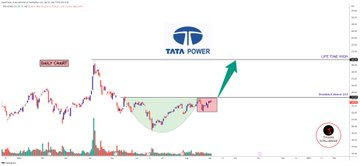
#TATAPOWER
chart as shared by
@amrishmohabey
triangle
#breakout
.
#StockMarket
#StocksInFocus
#stocks
#StocksToBuy
2
5
49
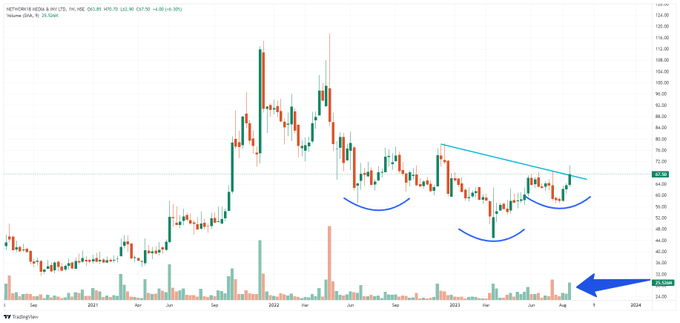
Weekly
#Breakoutsoon
with
@TechTradesTT
Stock No. 1 - NETWORK18
Entry Above 72+
🚦 SL 57
#Like
#Repost
for Next Stock
#tradingview
0
7
46
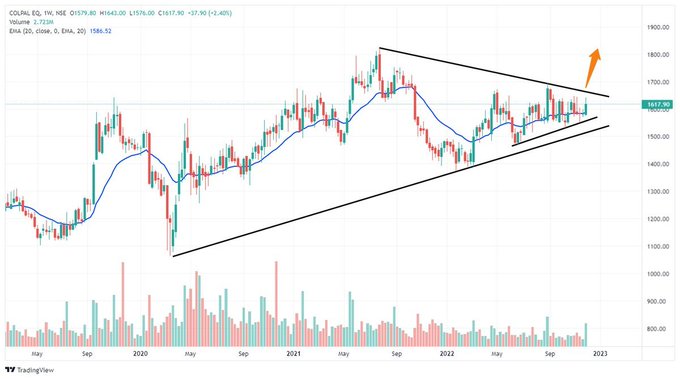
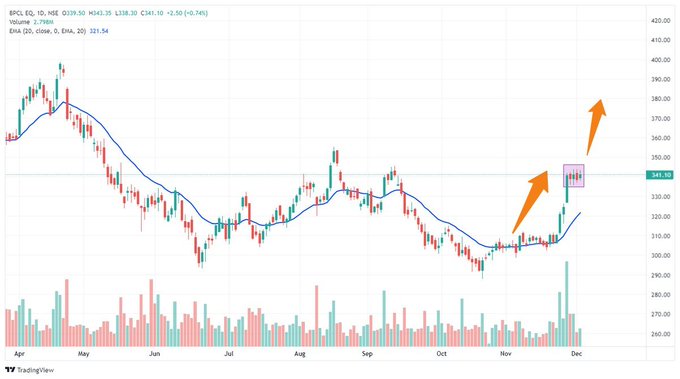
Happy Sunday Friends
Naren Joshi
@valuelevels
Sharing some interesting chart setup 🚀 🧐
COLGATE (W) 🚀
BPCL🚀
TATAPOWER 🚀
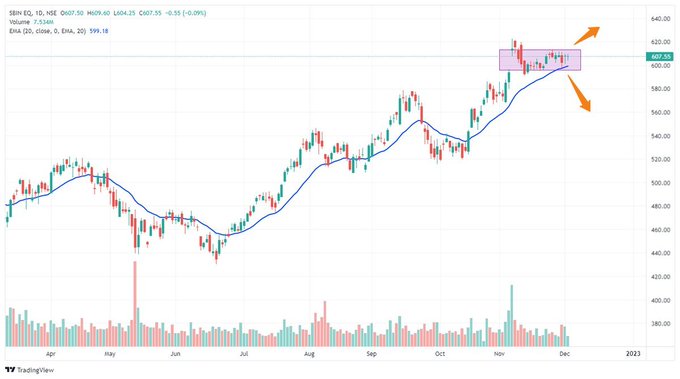
SBIN🔥
@StocktwitsIndia
#TechnicalTrades
#TradingView
0
6
46
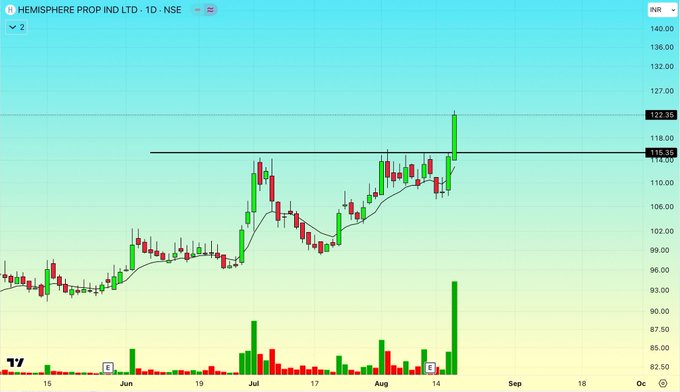
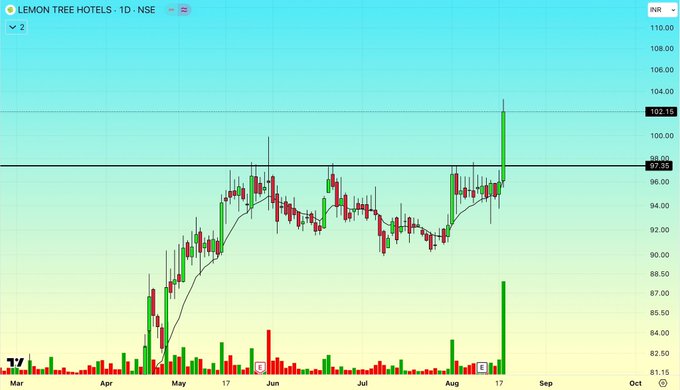
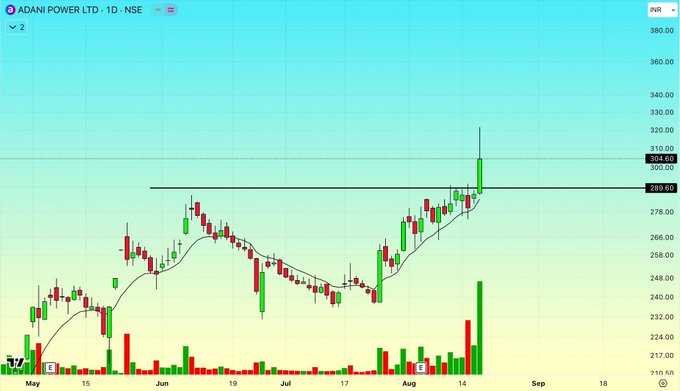
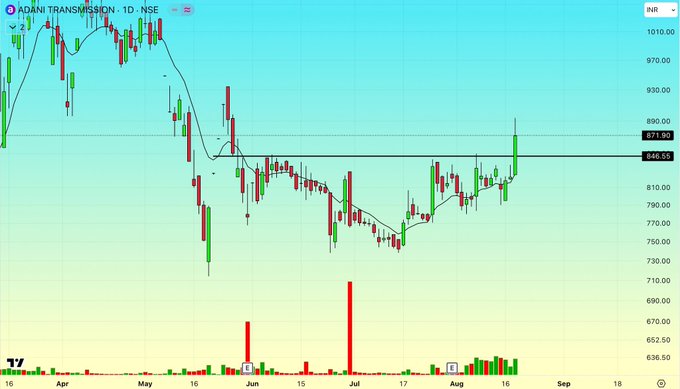
📌Strong
#Breakout
Stocks of The day
1️⃣ Hemisphere Prop
2️⃣ Lemon Tree
3️⃣ Adani Power
4️⃣ Adani Transmission
Chart setup by
@Trend_trader7
@WaveFinancial
@GarvModi70
@mystock_myview
@Ishan_Narayan_
1
5
45
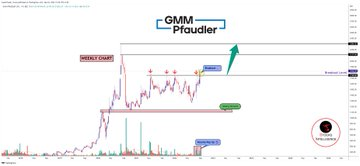
✨
#Breakout
+ Breakout Soon Stocks👇
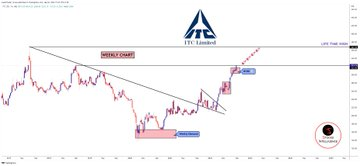
📌Tata Power
📌ITC
📌GMM Pfaudler
📌SunTV
Great work.. keep sharing more CA Vivek Khatri
@StocksINT
🚀👍👌
3
6
44
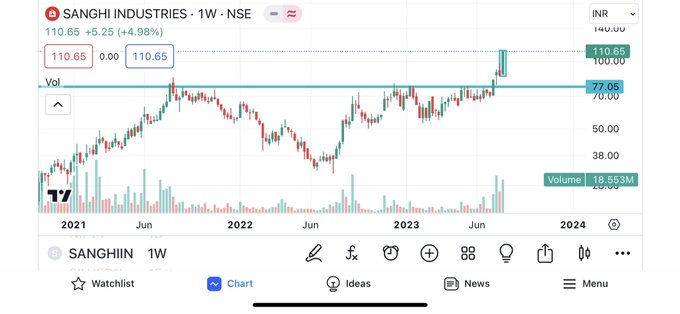
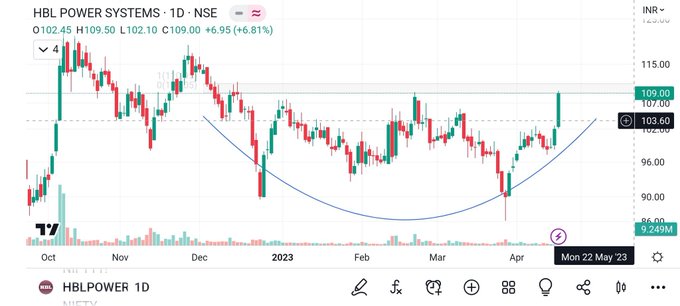
WEEKLY Cash Market BO Stocks 🚀🔥
1️⃣ IRFC
2️⃣ SANGHI IND
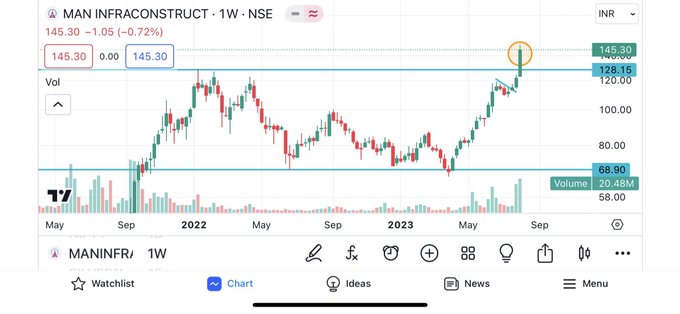
3️⃣ MAN INFRA
4️⃣ HBL POWER
#Like
#Retweet
for MAX Reach
Charts by
@GarvModi70
@nirajtanna
@AkashPa26944493
@yadavrahul0
@techmental_AK

1
8
44
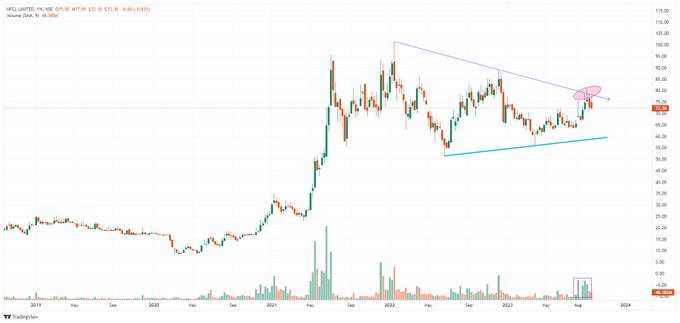
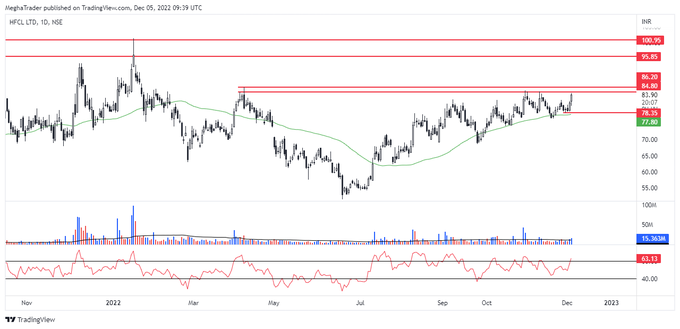
Weekly Stock Ideas with
@TechTradesTT
⭐️
Stock No. 3 - HFCL - Cmp 72
Wait for 80+ for some upmove/
#Breakout
Buyers should keep SL of 67 🚨
Like👍 & Repost 🔄 for Next Stock
#StocksToTrade
#stockstowatch
#banknifty
#sensex
#stockmarketindia
#stockmarketnews
#stockmarket
1
5
44
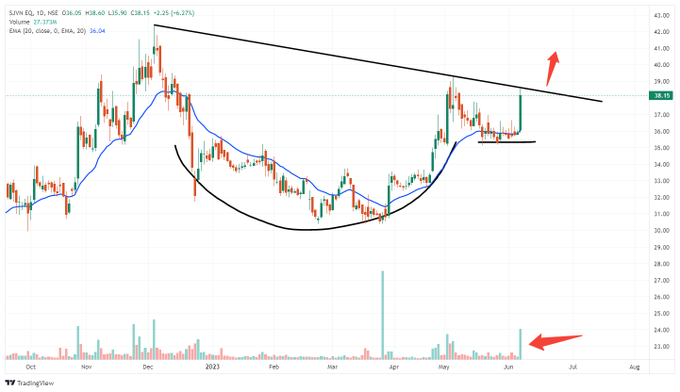
Stock To Trade Strategy -
#Like
#Retweet
for MAX Reach
SJVN - Cmp 38
Rising Volume
TL Resistance
Round/cup and handle Pattern
JOIN TELEGRAM FOR MORE TRADE IDEAS
#StocksToTrade
#stockstowatch
#stocks
#priceaction
#stockmarketindia
3
4
40
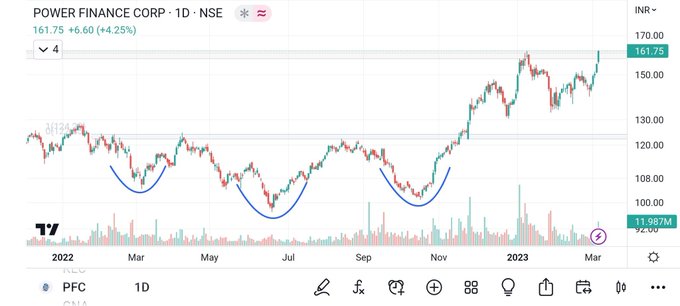
#weekly
#stocks
#MOIL
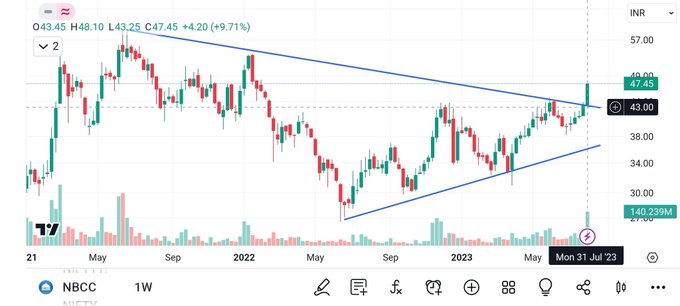
#NBCC
#PFC
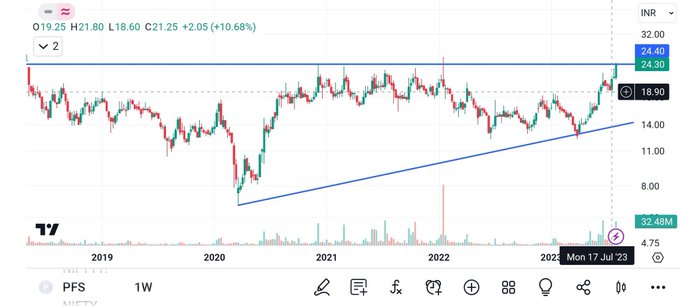
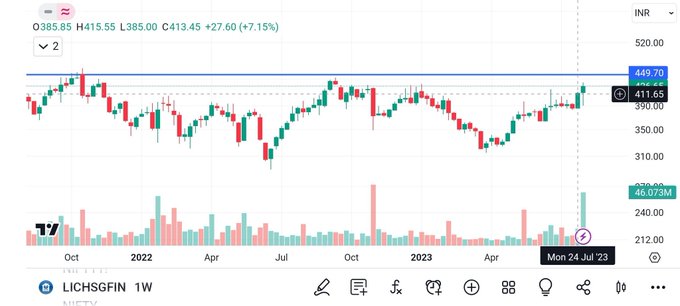
#LICHSGFIN
BreakOut Stock Charts by
@BakuSarman
👍 Simple & Clear analysis.. Keep sharing
@TechTradesTT
@Breakoutrade94
@BakuSarman
@STOCKBAGGER1

3
5
43
Some Complex candlestick patterns by
@valuelevels
thread 🧵🧵👇
Candlesticks are graphical representations of price movements for a given period of time. They are commonly formed by the opening, high, low, and closing prices of a financial instrument.

1
11
39
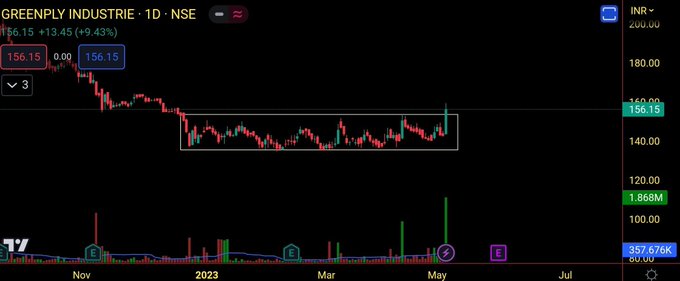
#GreenplyIndustries
Cmp- 156
Add on dip till 150
Target- 164-172-180
SL- 142 DCB
Chart Setup by
@me__kaushik
@STOCKBAGGER1
@Earner_Sanjeev
@ent_wala
@RICHADICT
@sonaliktalreja
@Stocksgeeks
@FinancialTradr
@imhiren7
0
6
42
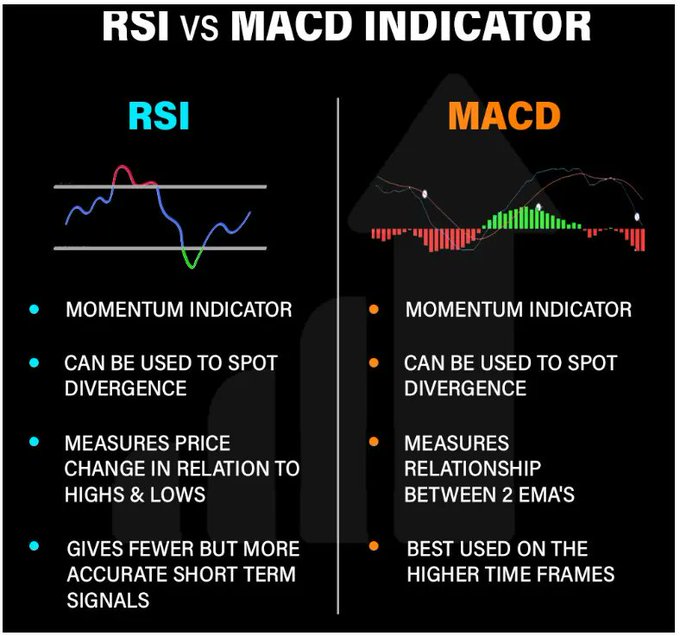
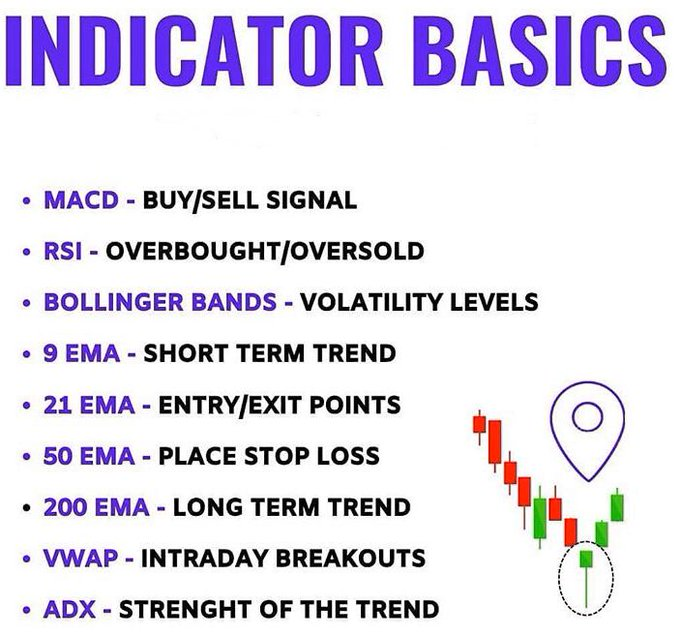
A technical indicator is a mathematical pattern derived from historical data used by technical traders or investors to predict future price trends and make trading decisions.
A thread 🧵 by Naren Joshi
@TechTradesTT
#LIke
#Retweet
for Max Reach
@tapariachandan
@Rishikesh_ADX
1
16
41
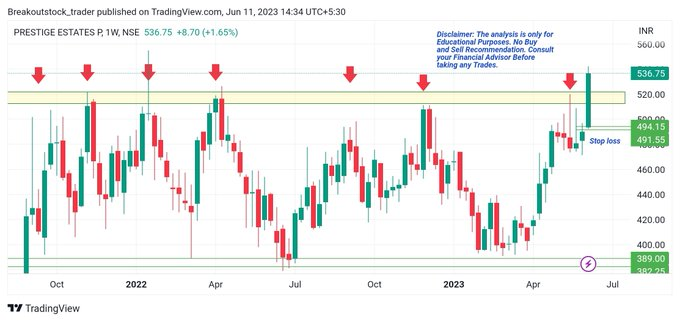
#prestigeestates
W
- strong breakout candidate
- strong bullish momentam
- breakout after good consolidation
- No buy sell recommendations
- always follow SL
#BREAKOUTSTOCKS
setup by
@Breakoutrade94
@GirishAnchanWMA
@RICHADICT
@TechnoChartist
@Addition_Singh
@Niteish_14
4
3
40
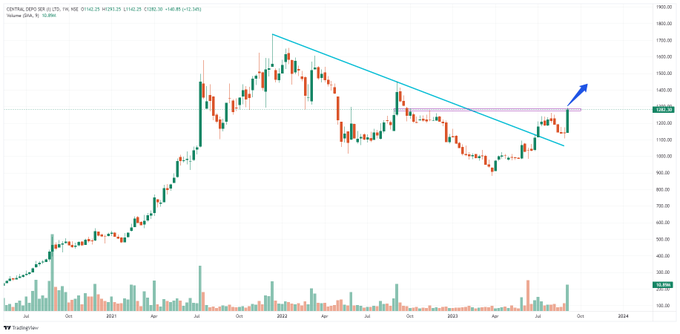
Weekly Stock ideas with Naren Joshi
@TechTradesTT
Stock No. 4
CDSL- Cmp 1282
🔥 Weekly Time Frame
🔥
#Breakout
level 1300+
🔥 Rising Volume
For Live Market updates👇
TELEGRAM Group Link 👇
#TradingView
0
6
40
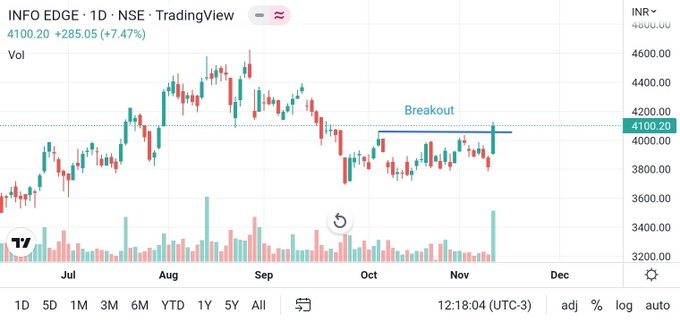
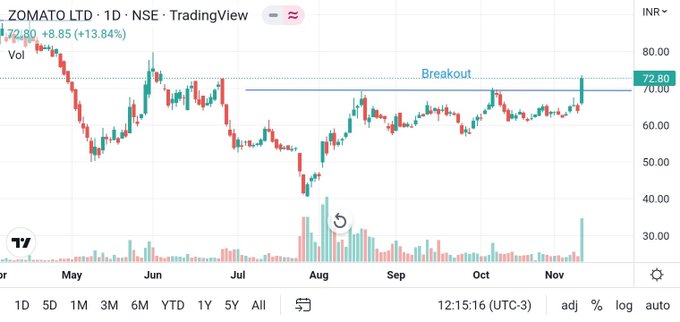
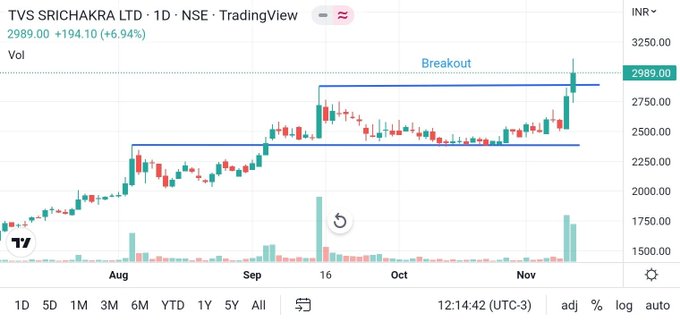
#high
#volume
#breakout
#stocks
for Monday
1. Allcargo logistics
2.zomato
3. Info edge
4. TVs srichakra
Setup idea by
@nirajtanna
@TradingView_IN
@valuelevels
@KommawarSwapnil
@nakulvibhor

1
7
39
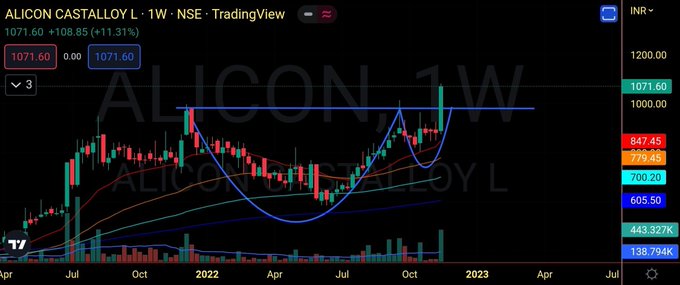
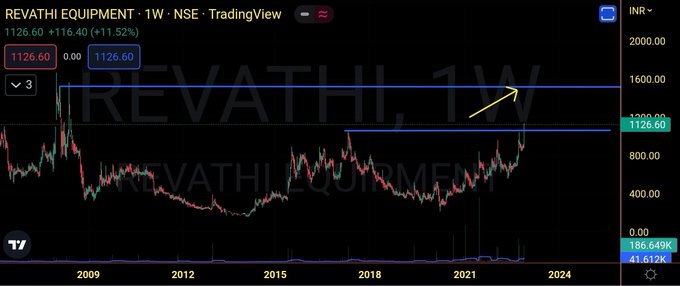
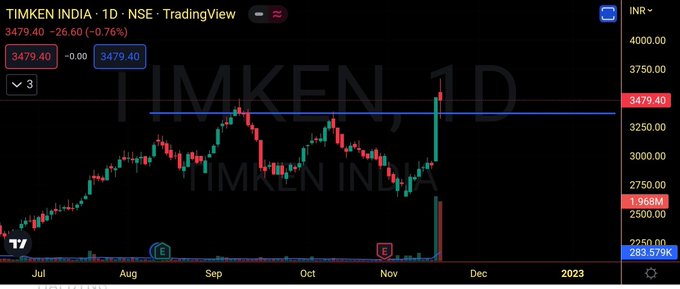
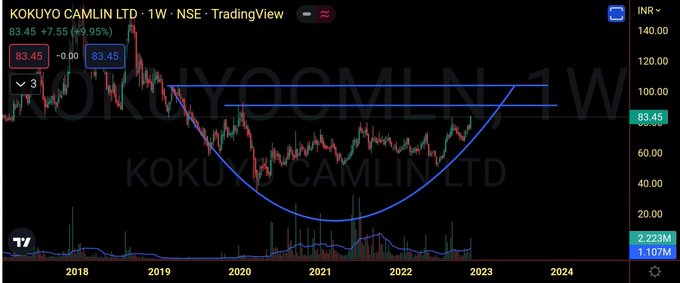
1)
#ALICON
2)
#REVATHI
3)
#TIMKEN
4)
#KOKUYOCMLN
Chart analysis by
@me__kaushik
👍 Excellent chart analysis.. Keep sharing with
@Stocktwit_IN
#TechnicalTrades
#TradingView
1
1
39
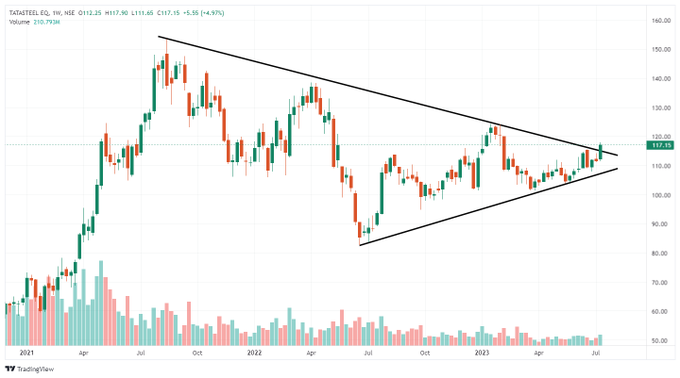
छोटा स्टॉक..... बड़ा धमाका 🔥🚀🚦by Naren
@TechTradesTT
Stock 1-
#TATASTEEL
Weekly Chart with Volume Rising 📊
TELEGRAM Group Link 👇
…
#BreakoutStock
#trading
2
2
38
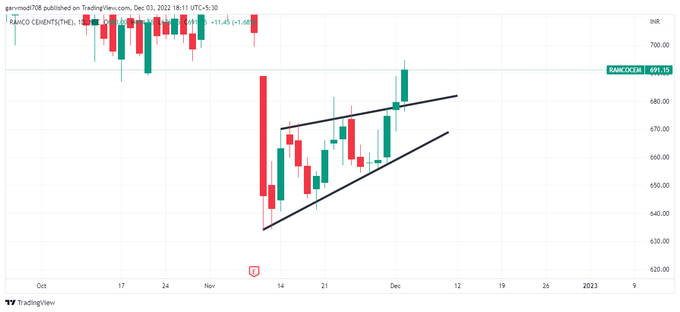
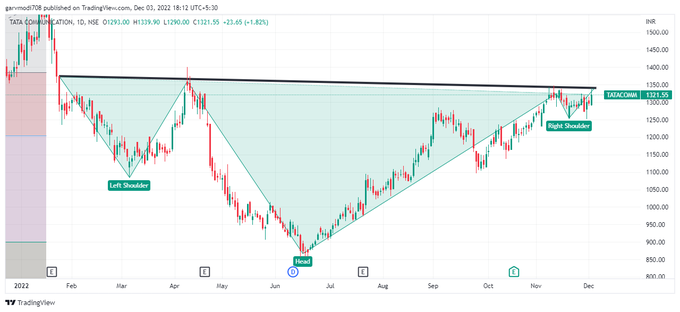
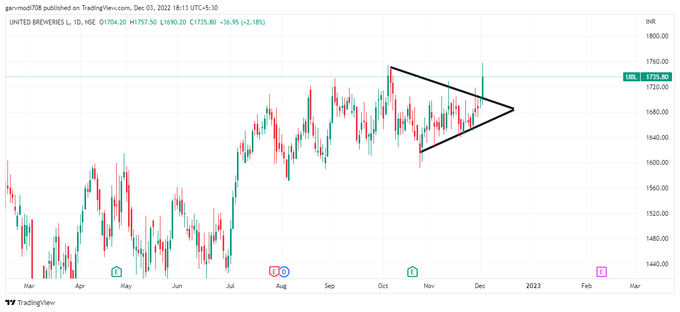
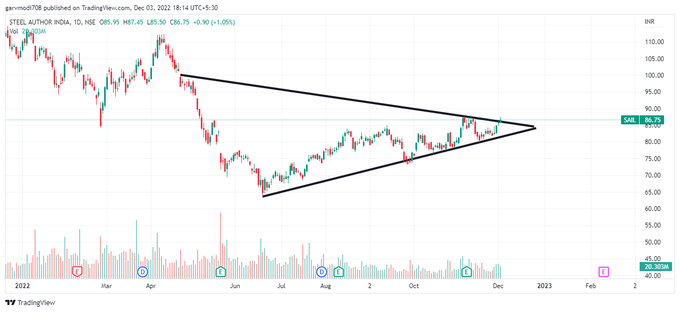
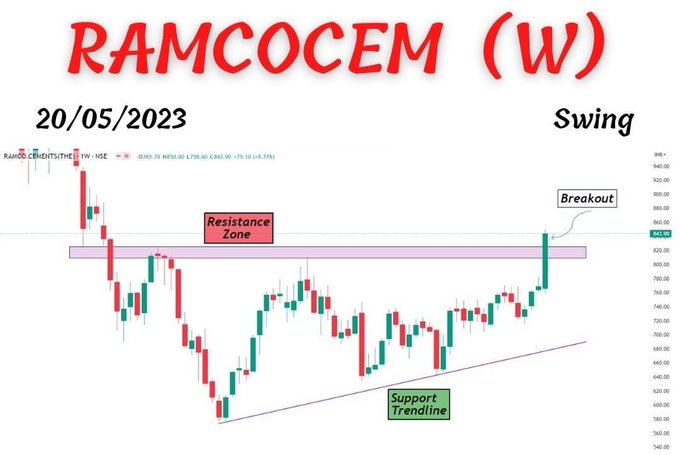
Stocks To Watch as shared by
@GarvModi70
#Sail
#UnitedBreweries
#RamcoSystem
#TataComm
👍 Excellent chart analysis.. Keep sharing with
@Stocktwit_IN
#TradingView
#TechnicalTrades
1
2
38
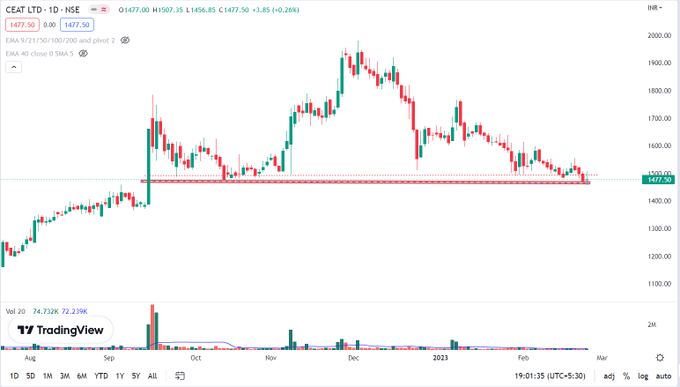
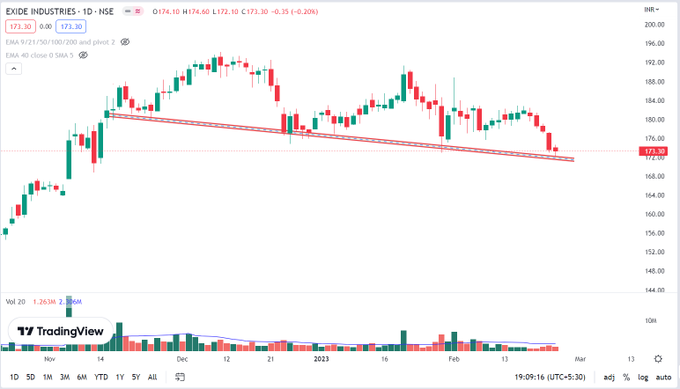
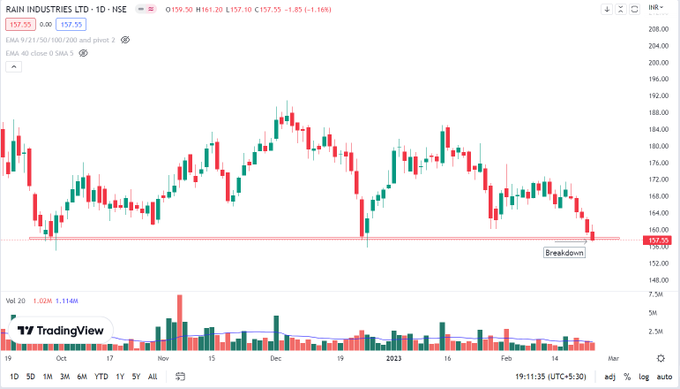
#stocks
at support & Breakdown of support
👌Great chart setups by
@RICHADICT
#Hindustancopper
🔻
#Ceatltd
🔻
#ExideIndustries
🔻
#Rainindustriesltd
🔻
#LIke
#Retweet
to Show your support for our Experts
#TradingView
#TechnicalTrades

1
3
38
A
#Breakout
idea from Mahmudul hassan
@MeghaTrader_MT
#HFCL
- Stock is getting ready
#LIke
#Retweet
to Show your support for our Experts
1
6
38
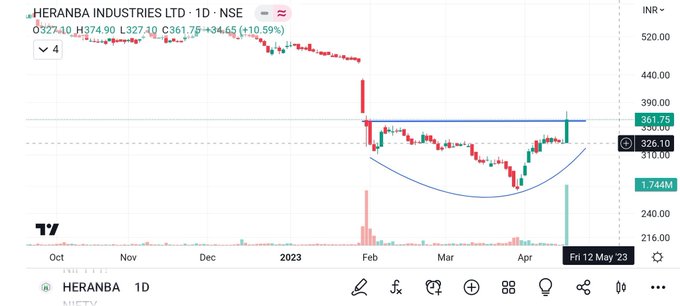
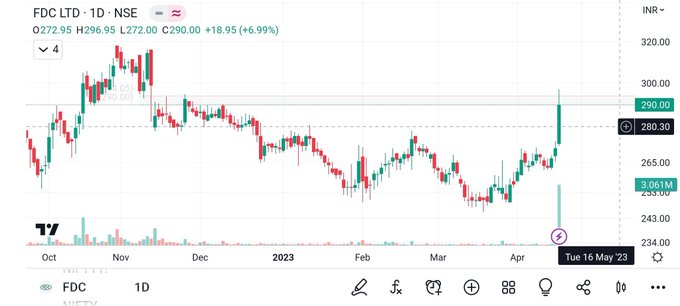
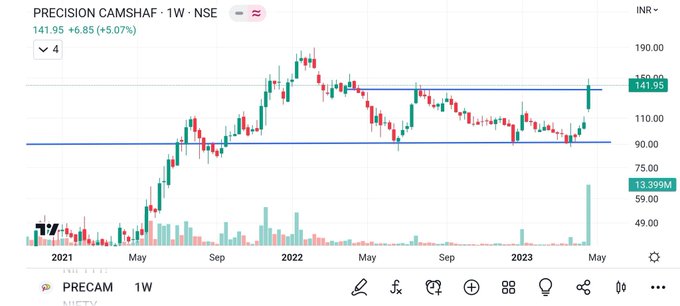
STOCKS TO WATCH
1.Heranba Ind
2.Fdc Ltd
3.Hbl Power
4.Precision Cam(W)
Chart setup from
@BakuSarman
#TradingSignals
4
4
38
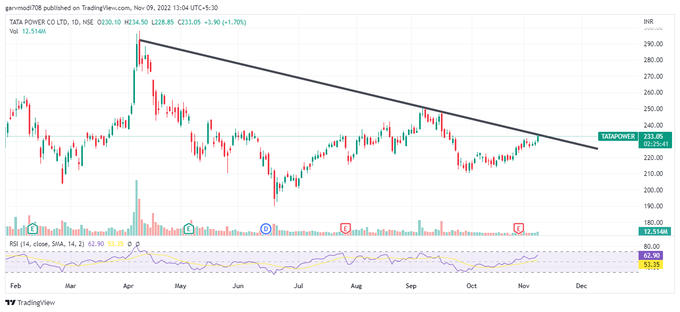
Tata Power views shared by Garv Jain
@GarvModi70
A Closing Above This Will Take It To 245-70
@vivbajaj
@ashish_tn
@BrkoutGeek
@purohitjay
@Intrinsic_cycle
4
7
36
Experts & Brokers Recos with Trading Views ↗️
@TradingView_IN
Buy Reliance Industries, 🚀TG price Rs 2439: ICICI Direct
Buy Grasim; 🚀TG of Rs 1900: Motilal Oswal
Buy L&T; 🚀TG of Rs 2600: Sharekhan
Buy Page Industries; 🚀TG of Rs 48,800: Emkay Global
#TradingView
1
4
38
#HINDALCO
Pre-breakout
▶️tgt-454
#stockstowatch
by Anurag Bhatt
@PriceisKing1
👍 Simple & Clear analysis.. Keep sharing with
@Stocktwit_IN
3
6
38
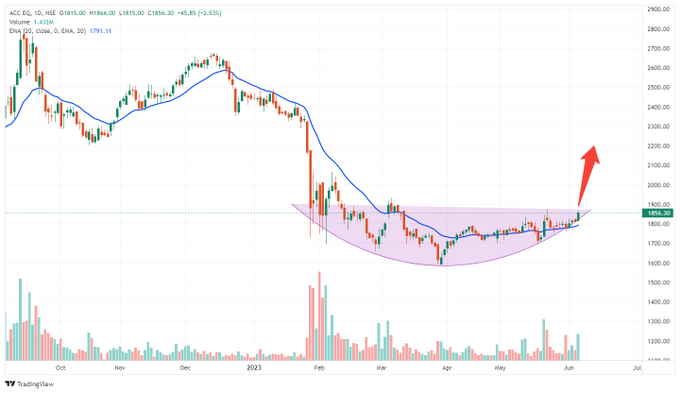
Chart idea by Naren Joshi
@TechTradesTT
POSITIVE BOUNCE BACK ⤴️ 🚀
🧨 With Volume 📊
ACC - 1870+
#Like
#Retweet
for MAX Reach
JOIN TELEGRAM FOR MORE TRADE IDEAS
#TechnicalTrades
#TradingView
3
1
35
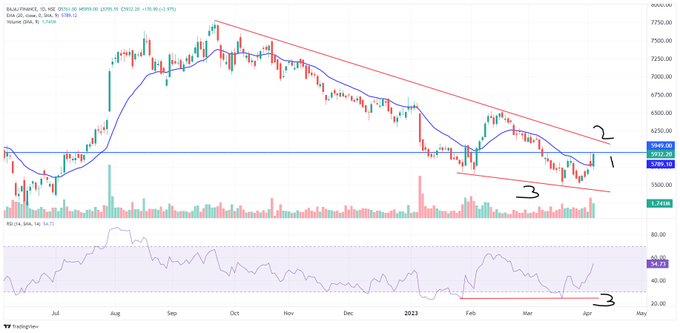
Some Short-term Strong Stocks of Nifty
A thread 🧵 of 4 Hot Stocks 🔥 By Naren Joshi
@TechTradesTT
1- BAJAJ FINANCE
-at major resistance
-rsi divergence
-good volume
@techmental_AK
@GarvModi70
@mystock_myview
@MeghaTrader_MT
4
3
35
Most Essential
#StockMarket
#CHART
Patterns
1. Ascending triangle
2. Descending triangle
3. Symmetrical triangle
4. Pennant
5. Flag
6. Wedge
7. Double bottom
8. Double top
9. Head and shoulders
10. Rounding top or bottom
11. Cup and handle

3
13
35
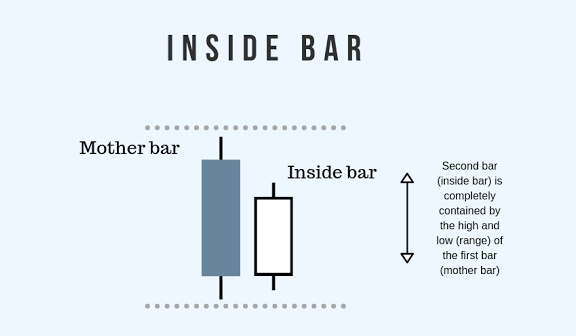
Inside bar trading strategy is a popular trading strategy among traders.
𝗔 𝗧𝗵𝗿𝗲𝗮𝗱 🧵 𝗼𝗻 𝗜𝗻𝘀𝗶𝗱𝗲 𝗕𝗮𝗿 by
@me__kaushik
RETWEET ♻ if you find it useful.
#StockMarket
#StockMarketindia
#trading
#stocks
6
7
36
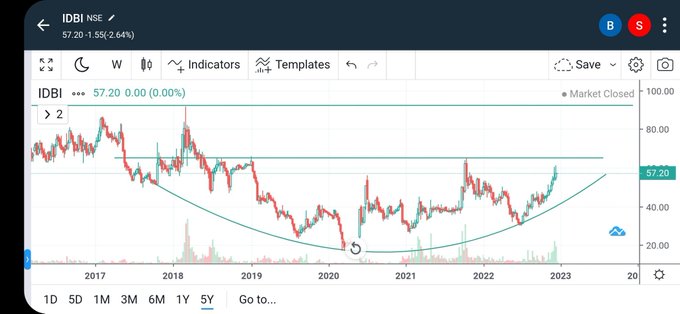
Keep On Radar !
IDBI BANK LTD, The Stock Is On Verge Of Multi Year Consolidation Breakout Also Volumes Are Looking Good.
Chart setup by
@GarvModi70
@TechTradesTT
@Breakoutrade94
@BakuSarman
@STOCKBAGGER1

1
4
37
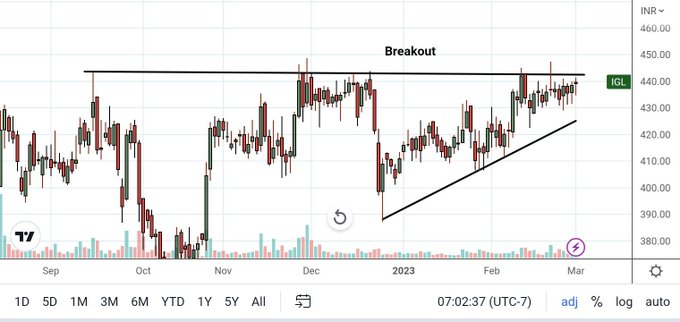
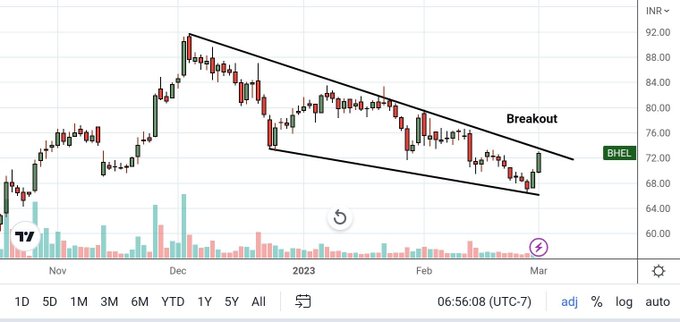
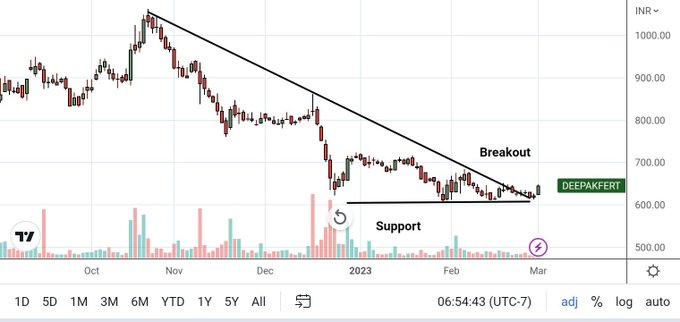
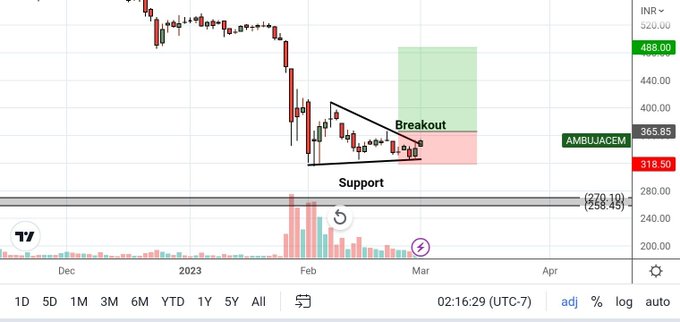
#breakoutstocks
for tomorrow
IGL
Ambuja cement
BHEL
Deepak fertilizer
Charts from
@nirajtanna
#TradingView
#TechnicalTrades
3
5
34
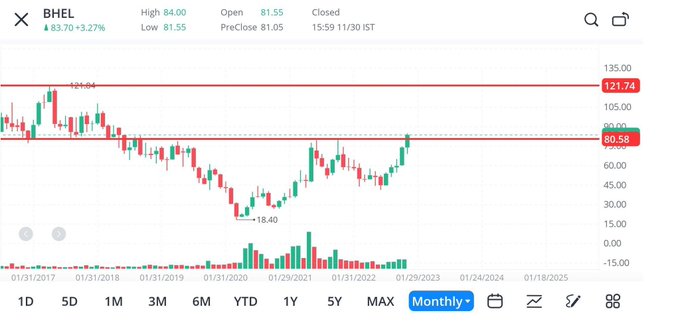
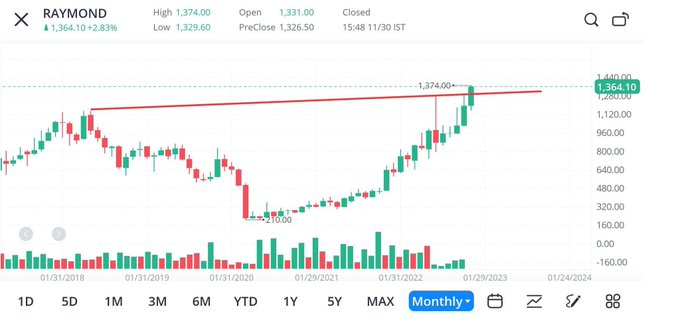
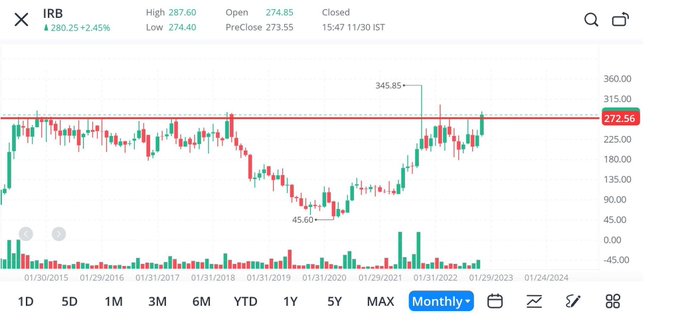
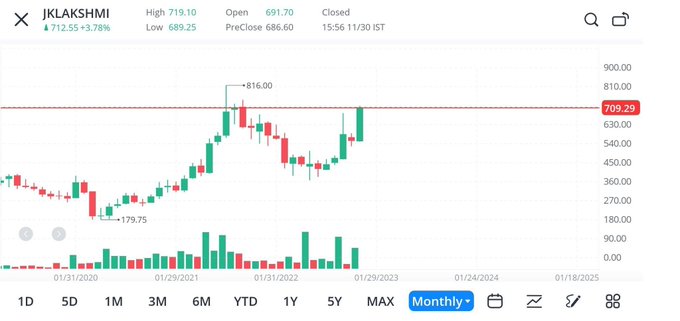
Kunal Shah
@cakunalshah1983
sharing some good monthly closed stocks.
Can be kept on rader🚀🔥
1️⃣ BHEL
2️⃣ Raymond
3️⃣ IRB infra
4️⃣ JK Lakshmi
#LIke
#Retweet
to Show your support for our Experts
1
7
34
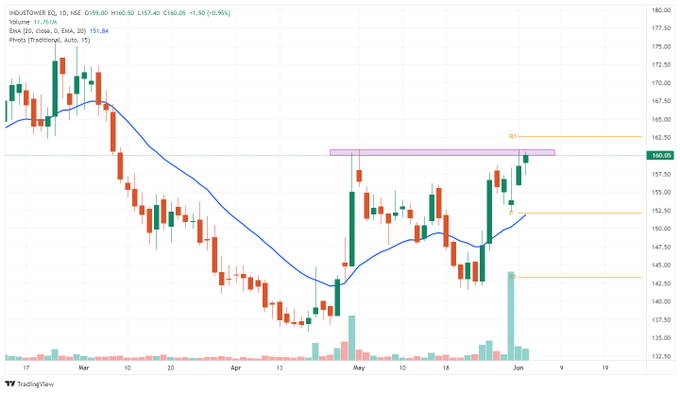
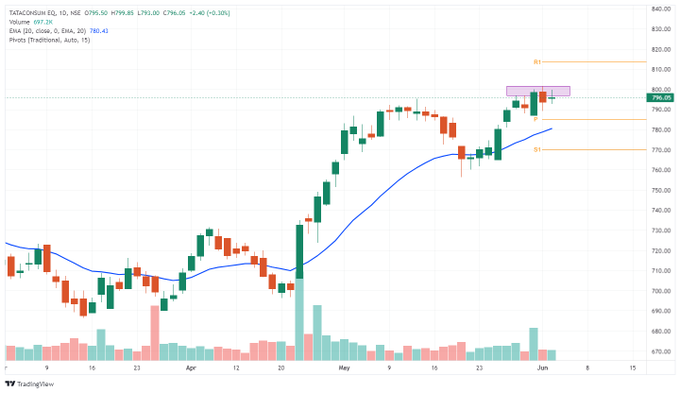
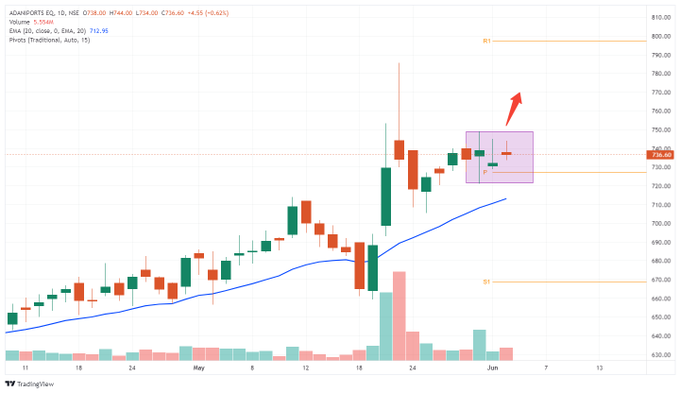
Stocks To Trade Strategy by Naren Joshi
@TechTradesTT
BUY Inside Bar - Range
#BREAKOUTSTOCKS
#Like
#Retweet
for MAX Reach🚀⤴️
1- ZEEL
2- INDUSTOWER
3- TATACONSUM
4- ADANI PORTS
JOIN TELEGRAM FOR MORE TRADE IDEAS
#tradingstrategy

0
5
35
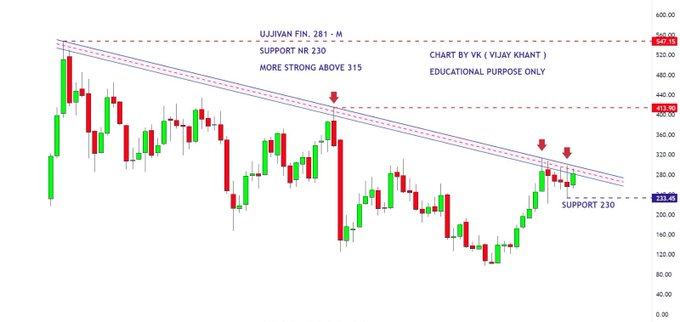
#UJJIVANFIN
.- M
ONE MORE SUSTAINING NR RESISTANCE....
Simple & Clear chart from
@mystock_myview
Keep sharing
@STOCKBAGGER1
@Earner_Sanjeev
@ent_wala
@RICHADICT
@sonaliktalreja
@Stocksgeeks
@FinancialTradr
@imhiren7
2
1
35
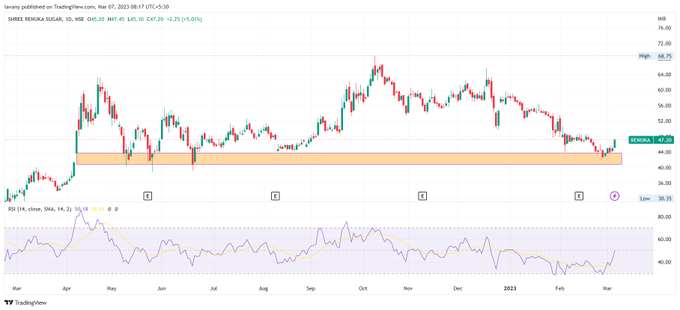
#renuka
sugars
reversal from support
one can buy with sl as base below...
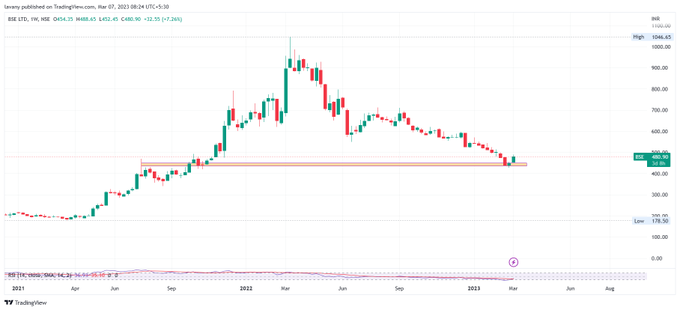
#bse
on weekly chart
aaj nahi tho kal
ye tho uupar hi jana jai.... keep an eye..
2 stock analysis by
@mrsoma227
#TradingView
#TechnicalTrades
1
6
34

Thank You Everyone 🙏
@Breakoutrade94
@GarvModi70
@mystock_myview
@MeghaTrader_MT
@cakunalshah1983
@PalorHarsh
@Sumitjain_16
@Trend_trader7
@nirajtanna

12
2
34
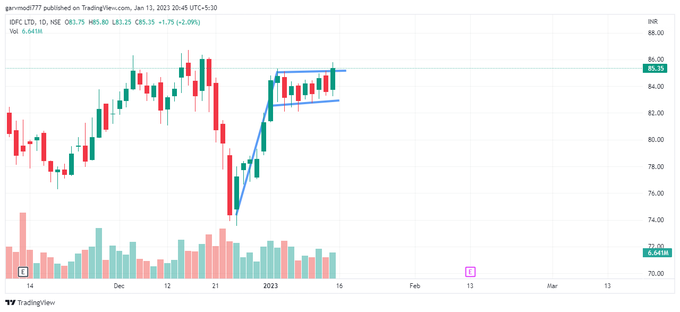
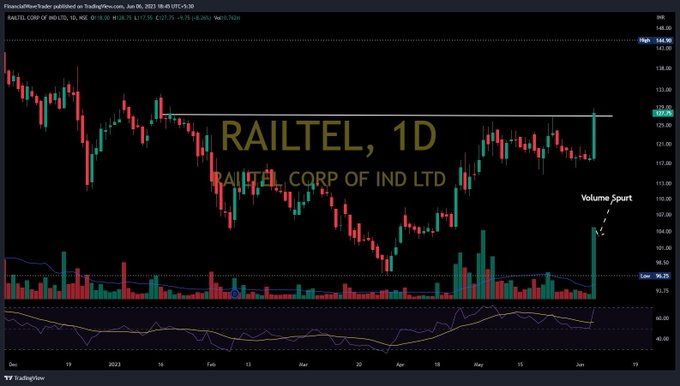
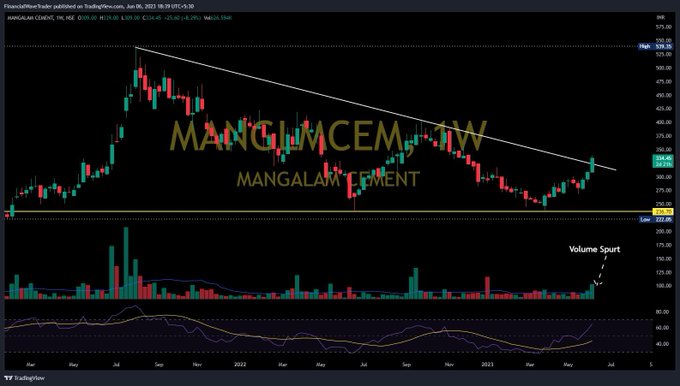
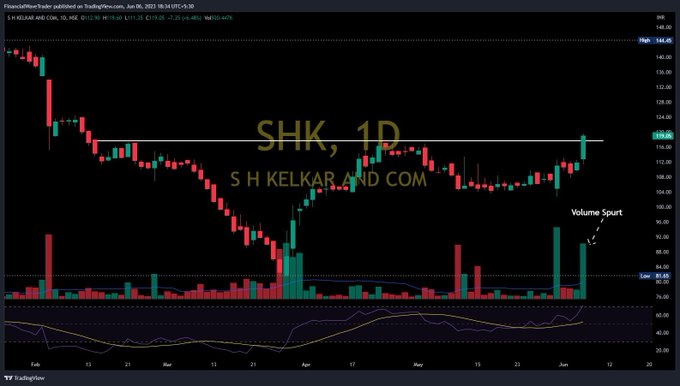
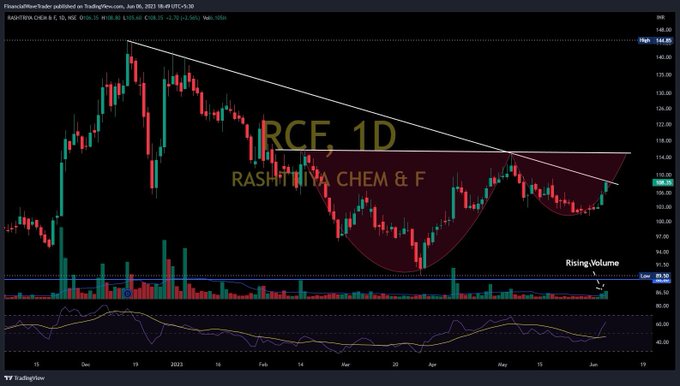
#STOCKS
Keep on Radar
#Breakout
and
#Breakoutsoon
#RAILTEL
#MANGLMCEM
#SHK
#RCF
#Like
#Retweet
for MAX Reach
Chart analysis from
@WaveFinancial
@GarvModi70
@mystock_myview
@me__kaushik
@TechTradesTT
@WaveFinancial
@Breakoutrade94
@BakuSarman
3
3
33
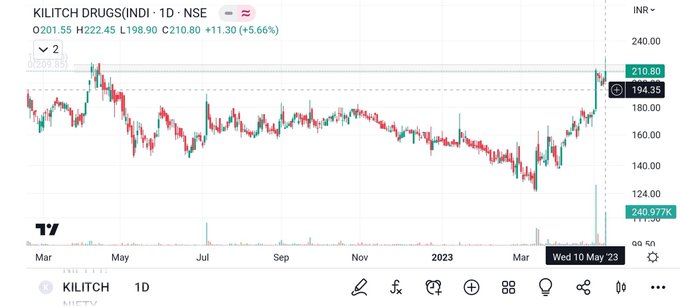
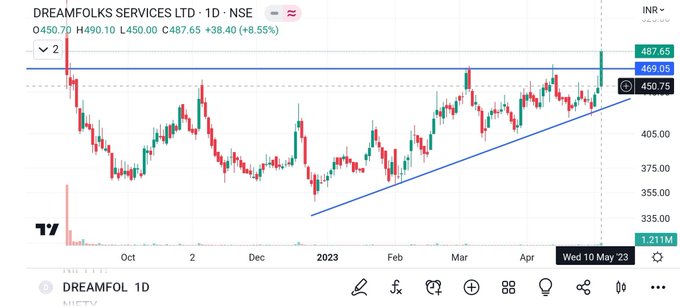
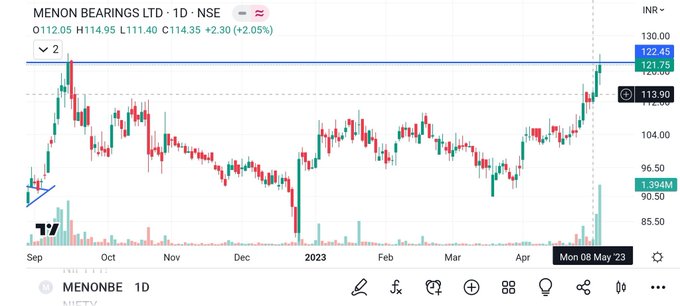
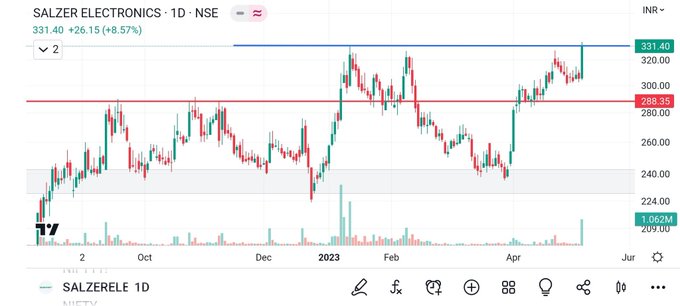
#breakut
#stocks
for tomorrow:
1.Kilitch Drugs
2.Dreamfolks
3.Menon Bearing
4.Salzer Ele
👍 Simple & Clear analysis from
@BakuSarman
.. Keep sharing with
@Stocktwit_IN
@techmental_AK
@GarvModi70
@mystock_myview
@MeghaTrader_MT
2
3
34
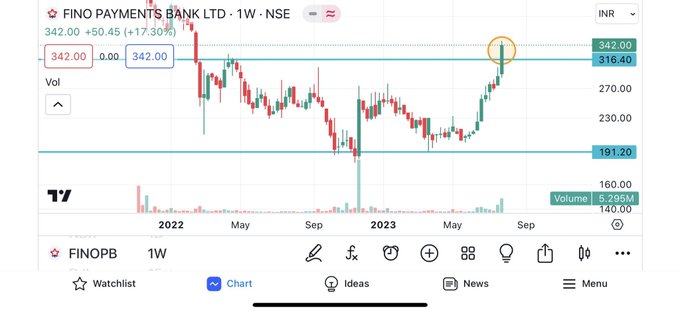
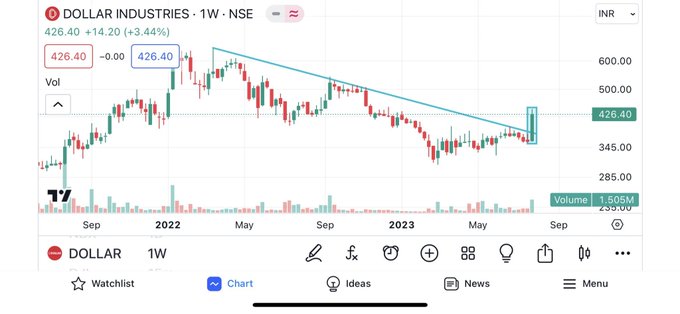
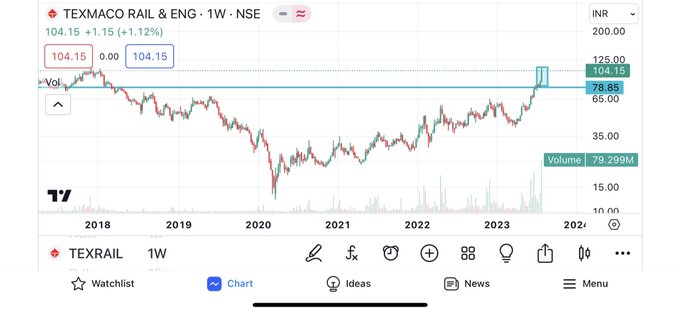
1️⃣ FINO PAYMENT B
2️⃣ DOLLAR IN
3️⃣ GODFREY PHIL
4️⃣ TEXMA
WEEKLY Cash Market
#BREAKOUTSTOCKS
🚀🔥 by
@GarvModi70
@TechTradesTT
@WaveFinancial
@mystock_myview
@Breakoutrade94

0
3
34
STOCKS TO WATCH TOMORROW 🧐
#BREAKOUTSTOCKS
by
@TCymatics
#Like
#Retweet
for Next stock idea💡
@sonaliktalreja
@Stocksgeeks
@FinancialTradr
@imhiren7
@karthimaths
@me__kaushik
@WaveFinancial
@Niteish_14
1
6
33
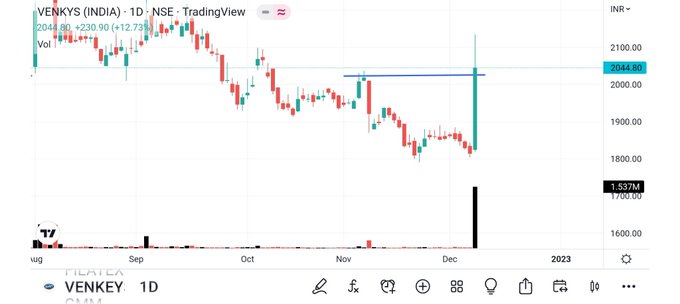
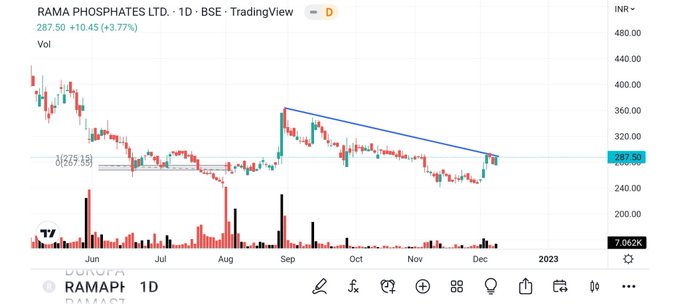
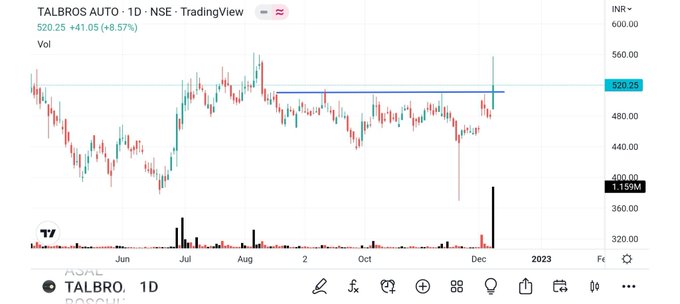
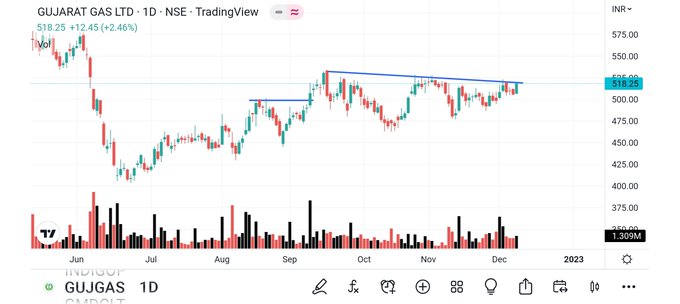
4 chart ideas of Bhavesh
@BRavaiya
#VENKEY
🔥
#RAMAPHOSPHATE
🔥
#TALBROS
🔥
#GUJGAS
🔥
👍 Simple & Clear analysis.. Keep sharing with
@Stocktwit_IN
@dmdsplyinvestor
@brahmachary
@sunilgurjar01
@charts_breakout
1
6
33
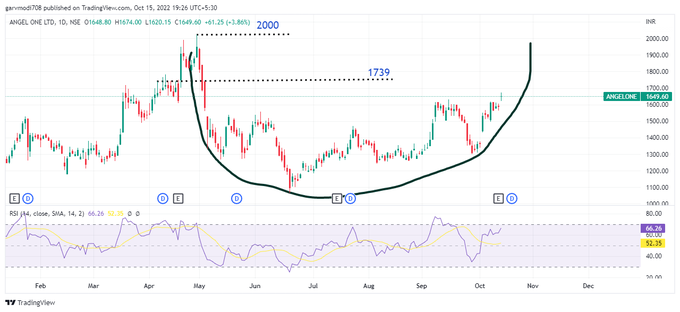
Angel One Has the Potential To Complete Rounding Bottom
Target For It Could Be 1730-2000
Posted Very Good Result
Sl-1480
Nice chart setup Bro
@GarvModi70
@nishkumar1977
@kuttrapali26
@aakankshalovely
@AmitabhJha3
@MarketScientist
5
2
33
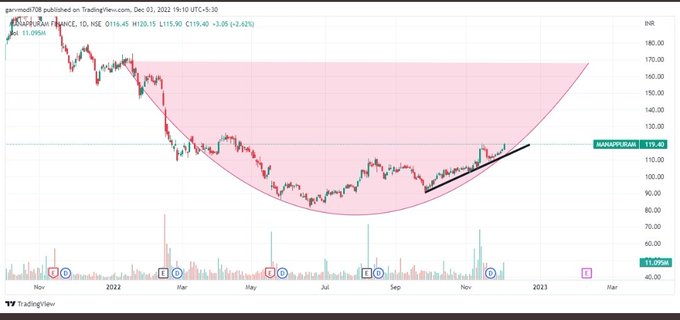
Manappuram Finance Ltd
Looks Good
One Cand Add For 140-70
Can Trade With Trend Line
Simple & clear analysis by
@GarvModi70
#LIke
#Retweet
for Next stock idea💡
0
4
31
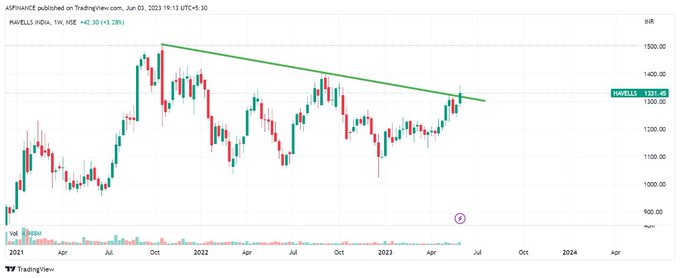
#HAVELLS
looking good with Volume
#Tradingview
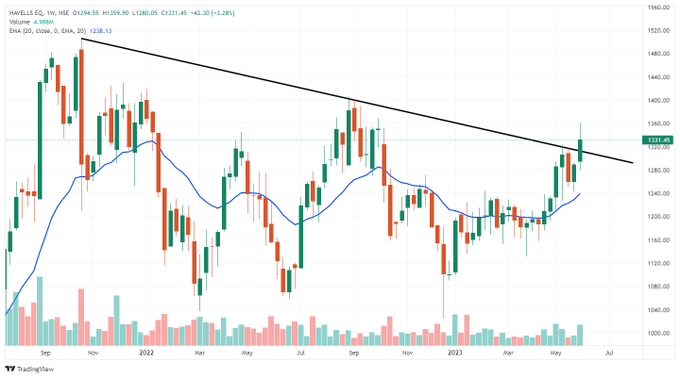

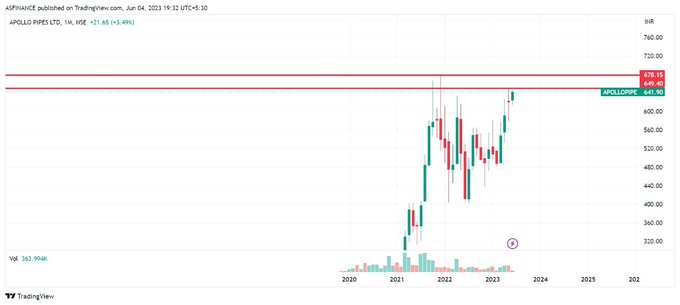
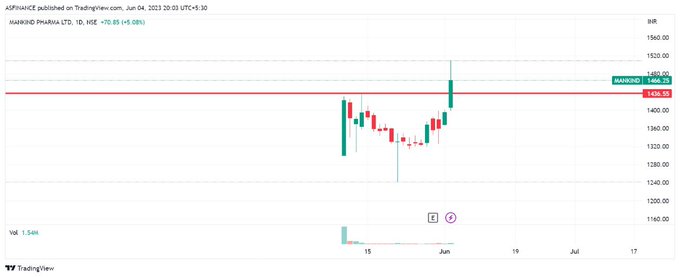
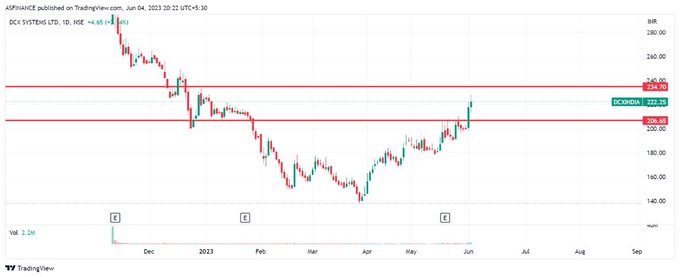
📊STOCKS IN FOCUS FOR INCOMING DAYS
1- HAVELLS INDIA
2- APOLLO PIPE
3- MANKIND PHARMA
4- DCX SYSTEM
@kuttrapali26
@jitu_stock
@caniravkaria
@ASFINANCE825
1
1
15
0
2
33
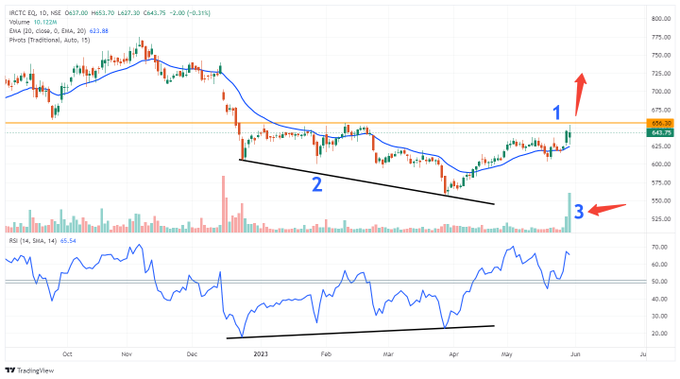
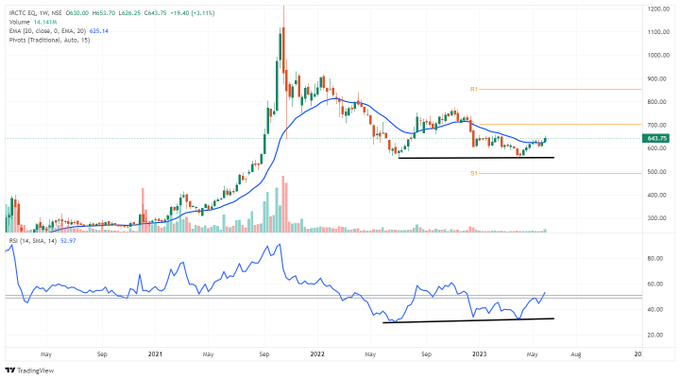
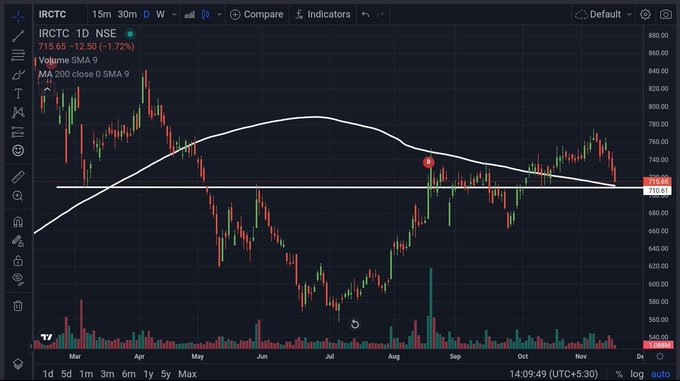
Kya Lagta hai iss bar ?
#TradingView
on IRCTC
D & W TF
@GarvModi70
@mystock_myview
@me__kaushik
@TechTradesTT
@WaveFinancial
@Breakoutrade94
@BakuSarman
@GirishAnchanWMA
@RICHADICT
@TechnoChartist
@Addition_Singh
@Niteish_14
@STOCKBAGGER1
5
1
32
Weekly Stock Setup with
@TechTradesTT
Stock No. 4- M&MFIN
Keep an eye on 306-307+
#BREAKOUT
RSI > 50
#Like
#Repost
for MAX Reach
.
TELEGRAM Group Link 👇
.
#TradingView
1
4
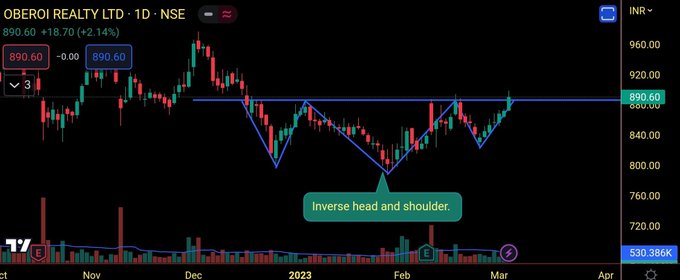
33
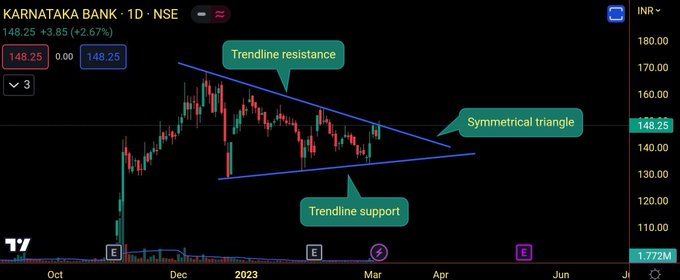
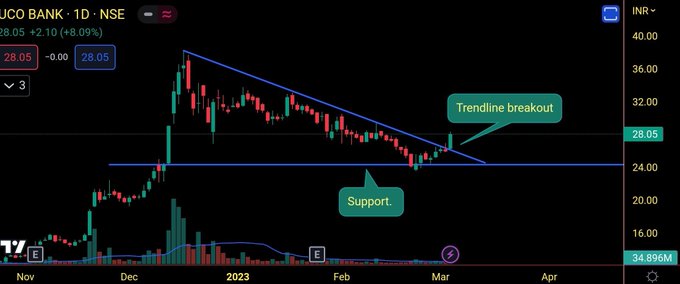
#KARNATAKABANK
#UCOBANK
#OberoiRealty
#ITD
Retweet ♻ for maximum reach
Stock ideas by
@me__kaushik
#TechnicalTrades
#TradingView

0
6
33
IIFL finance, The stock is on verge of breaking out.
Keep On Radar!
Chart idea by
@GarvModi70
#TradingView
@KommawarSwapnil
@nakulvibhor
@Abhishekkar_
@chartmojo

3
3
33
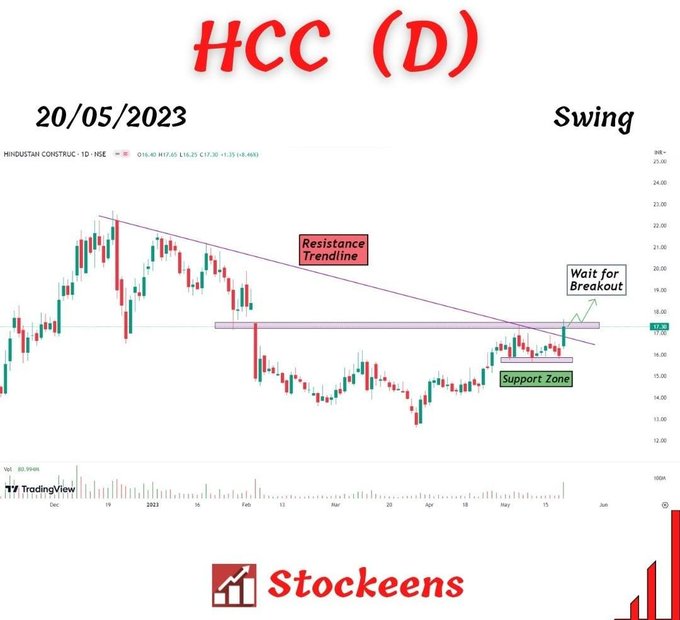
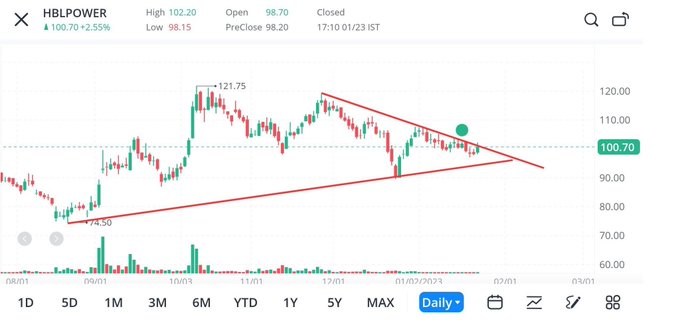
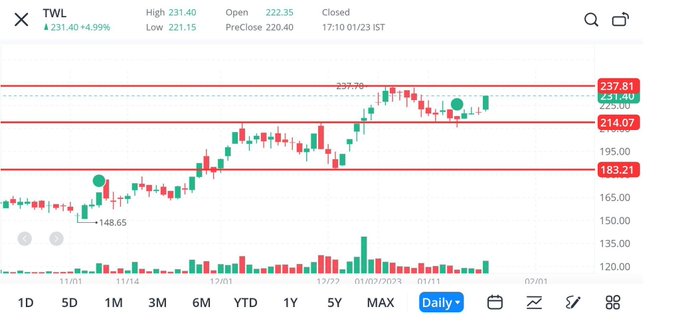
#BREAKOUTSOON
Catch it before
#Breakout
. .🏃🏃🏃
1️⃣ HBL Power🔥🚀
2️⃣ HCC🔥🚀
3️⃣ TWL🔥🚀
#Like
#Retweet
for Next stock idea💡
#TradingView
#TechnicalTrades

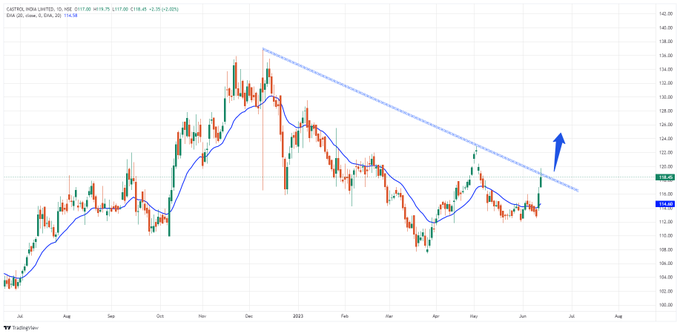
1
4
33
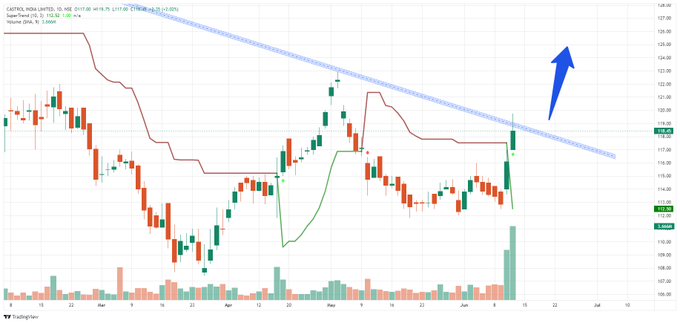
Super Trend + Rising Volume Strategy 📊
Chart Setup by
@TechTradesTT
CASTROLIND - cmp 118
🟢 Looking good above 120+
Buyers SL 111
TELEGRAM Group Link 👇
#Like
#Retweet
for MAX Reach
#tradingView
0
5
31
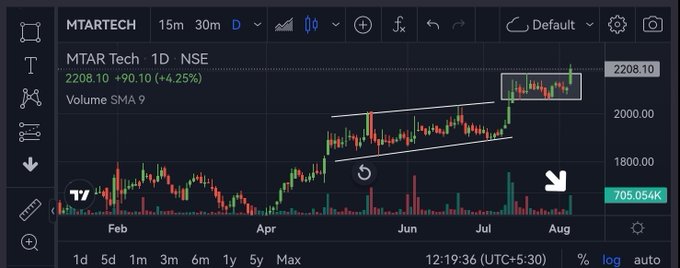
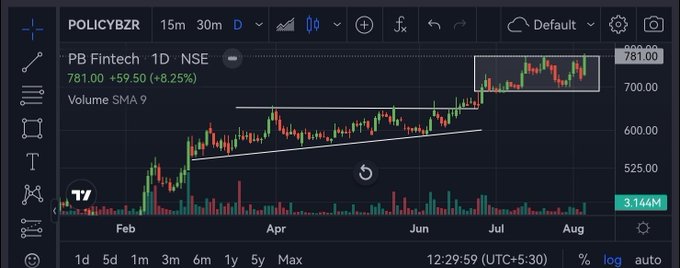
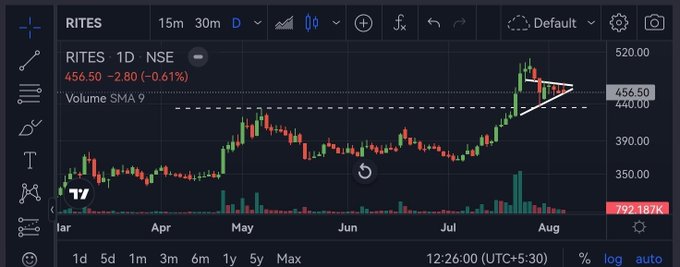
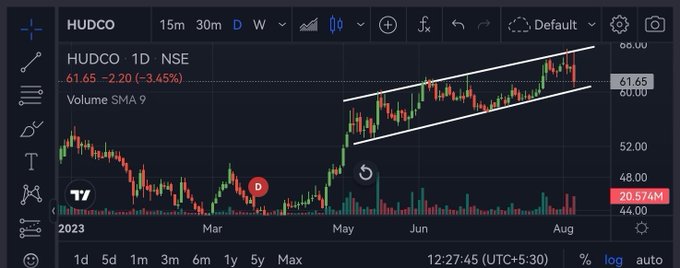
#StocksInFocus
🔥
MTAR Tech
PolicyBazaar
Rites
HUDCO
Chart setups from
@Ishan_Narayan_
@WaveFinancial
@GarvModi70
@mystock_myview
2
6
31
A very simple & clear chart idea from
@mystock_myview
#globusspirits
- W
➡️ Trend changing
➡️ St positive
➡️ More strong above 1075
#Like
#Retweet
for Next stock idea💡
@GarvModi70
@cakunalshah1983
@TechnoChartist
@STOCKBAGGER1
@Earner_Sanjeev
@ent_wala
@RICHADICT


1
4
33
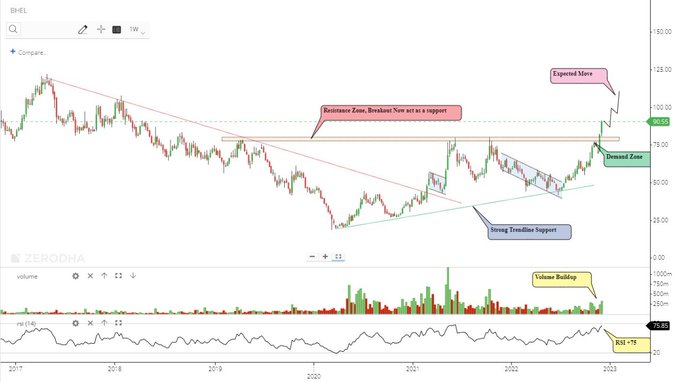
#Bhel
-
#psu
CMP : 90.55
Will a new ATH create?
Chart by imhiren
@imhiren7
#TradingView
#TechnicalTrades
#StocksToTrade
#stockstowatch
#stockmarketindia
0
3
33
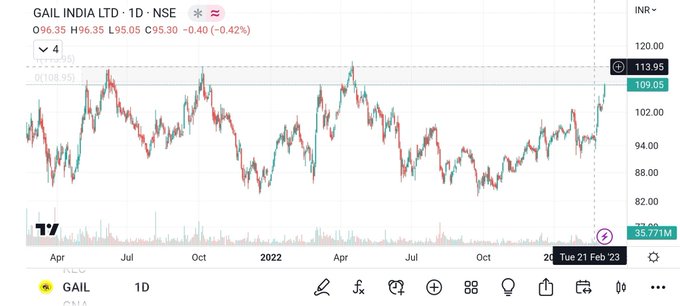
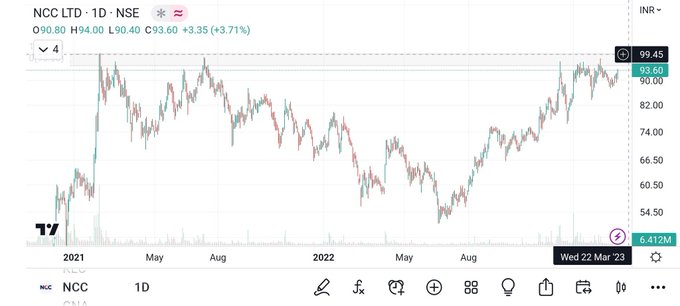
#StocksInFocus
Charts by
@BakuSarman
1.IGL
2.GAIL
3.PFC
4.NCC
👍 Simple & Clear analysis.. Keep sharing with
@Stocktwit_IN
0
2
31
#engineersindia
- W
Enter only where RR FAVOURABLE
👍 Simple & Clear analysis by
@mystock_myview
.. Keep sharing with
@Stocktwit_IN
@BakuSarman
@Sumitjain_16
@cakunalshah1983
@TechnoChartist

2
5
31
Graphite Ind - Descending triangle BO 🚀
IFB Ind - Beautiful BO on big volume! 🚀
IRCTC - At high-demand zone 🚀
Chart analysis from
@Ishan_Narayan_
@Pathik_Trader
@KA_charts
@niftywizard
@VRtrendfollower
@chartmojo


2
4
31
10 midcap & smallcap
#stocks
which have potential to 2x in next 5 yrs
#tradingstrategy
shared by Himani
@STOCKBAGGER1
1 Time technoplast
2 Redington
3 Latent View
4 kpit
5 Borrosil renewable
6 Craftsman automation
7 RHI magnesita
8 Jsw energy
9 Praj Ind
10 Zydus Wellness
3
9
30
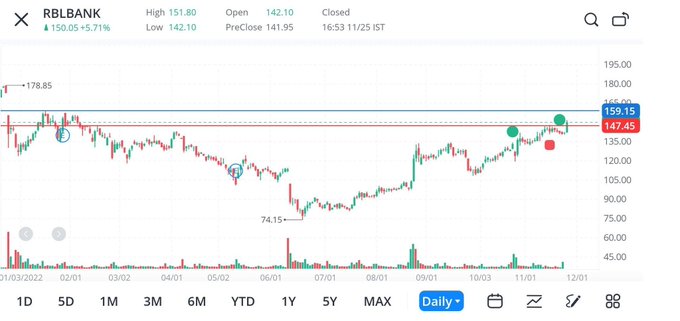
Mr. Kunal Shah
@cakunalshah1983
is sharing his views
#RBLBANK
- Inverse H&S breakout soon. Looks more attractive once it crosses 159 level.🚀
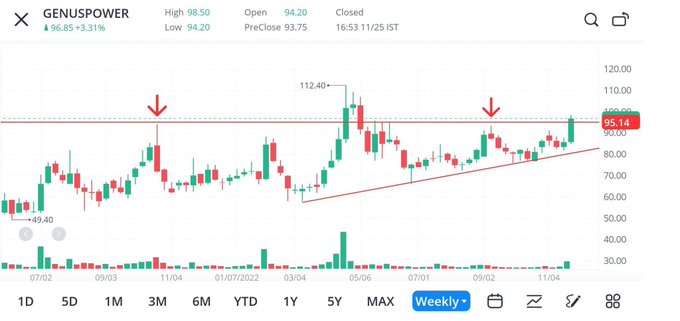
#GENUSPOWER
-
#Breakout
on weekly basis above 95. Can see more sparkling next week.🚀
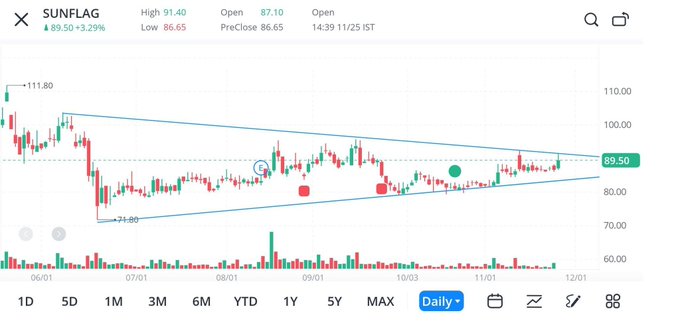
#SUNFLAG
- Symetircal triangle brekout possible. 🔥
1
9
32
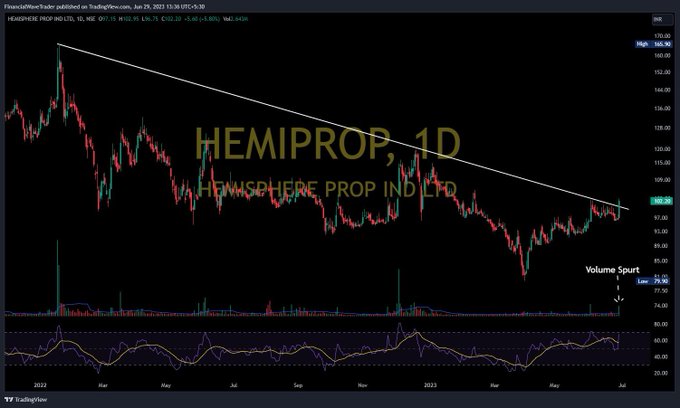
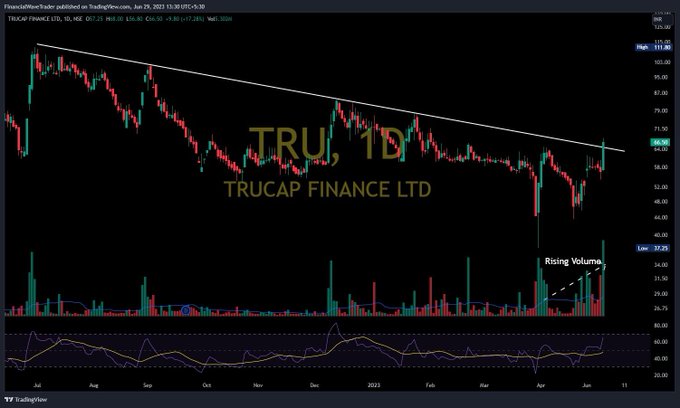
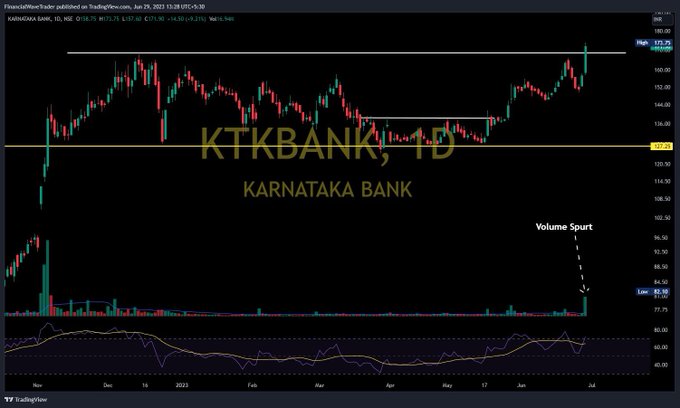
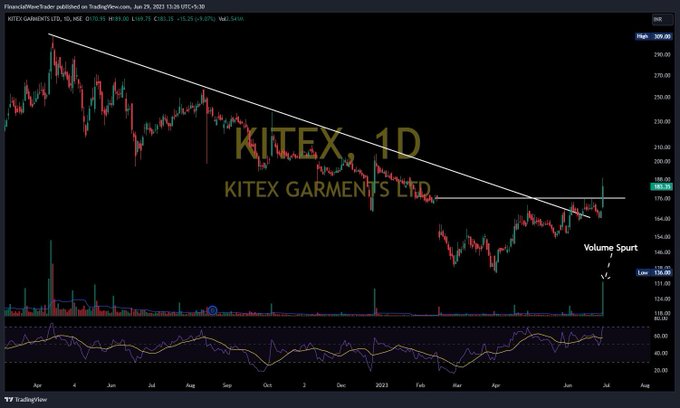
#Stocks
Keep on Radar
#HEMIPROP
#TRU
#KTKBANK
#KITEX
#Breakout
and
#BreakoutSoon
by
@WaveFinancial
@GarvModi70
@mystock_myview
@Breakoutrade94
@BakuSarman
@STOCKBAGGER1
3
3
32
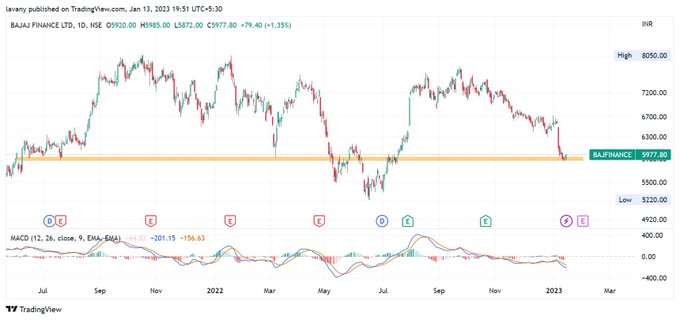
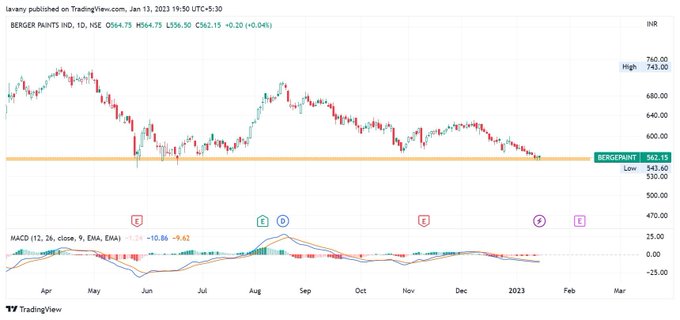
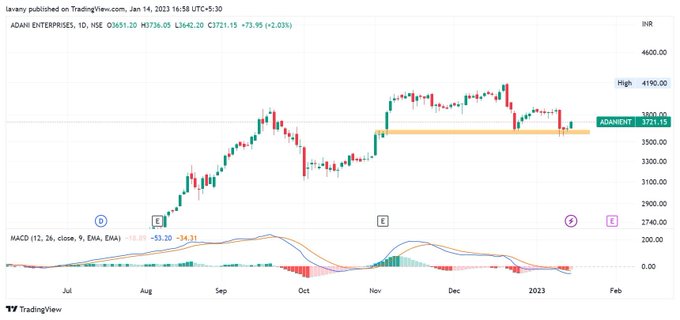
Some charts may reverse from here..
Setups by
@mrsoma227
#infoedge
📉📈
#bajfinance
📉📈
#bergerpaints
📉📈
#adanient
📉📈
@KommawarSwapnil
@nakulvibhor
@Abhishekkar_
@chartmojo
@KhapreVishal

4
2
32
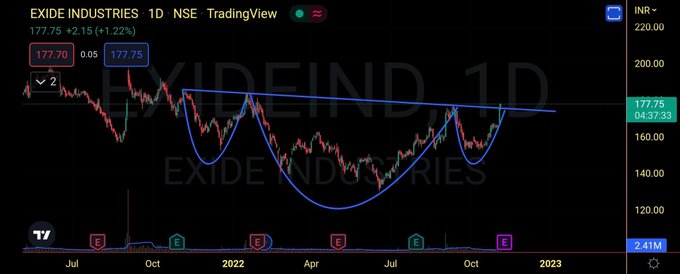
Exide industries
Cmp-177
Fresh breakout given
Inverse H&S pattern
Chart setup by Kaushik
@me__kaushik
#TechnicalTrades
#TradingView
4
1
31
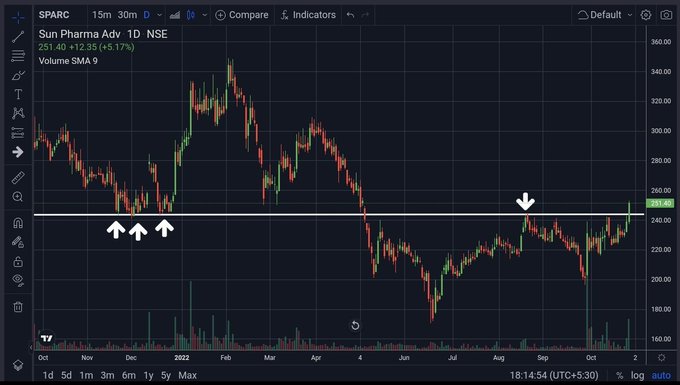
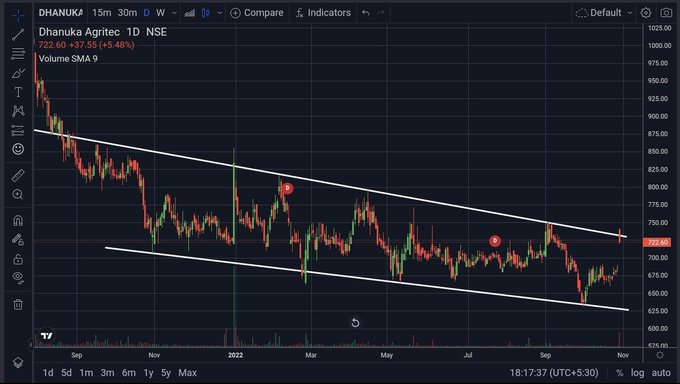
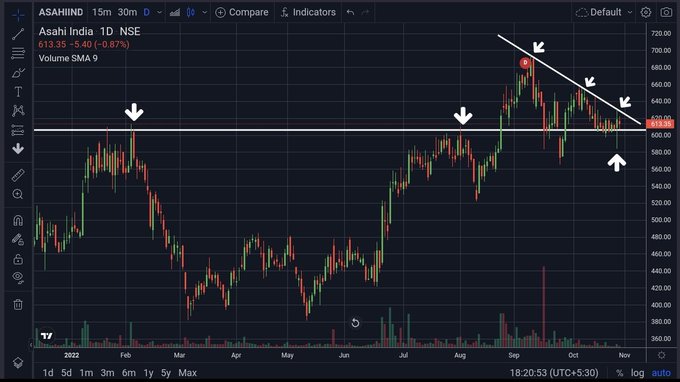
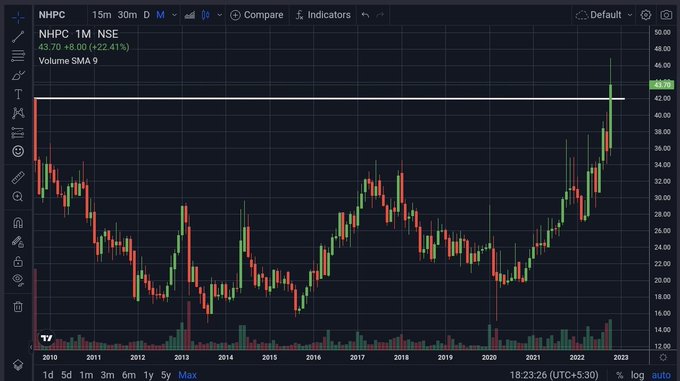
4 Stocks To Watch 🔥 as shared by
@Ishan_Narayan_
-SPARC
-Dhanuka
-Asahi India
-NHPC
@kuttrapali26
@purohitjay
@Intrinsic_cycle
@dtf_framework
@DiscretePriti
@ProfitKing7
#TechnicalTrades
#TradingView
1
5
31
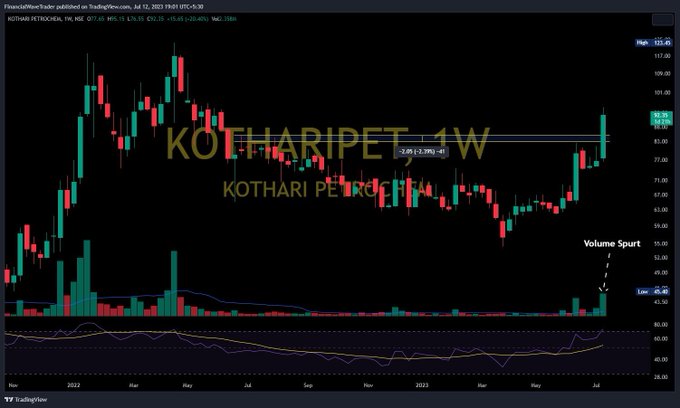
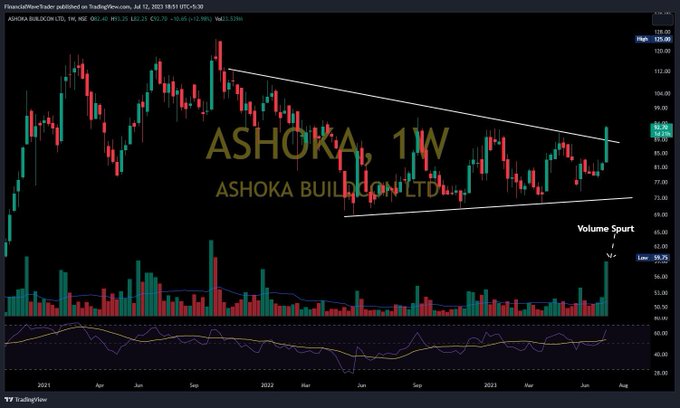
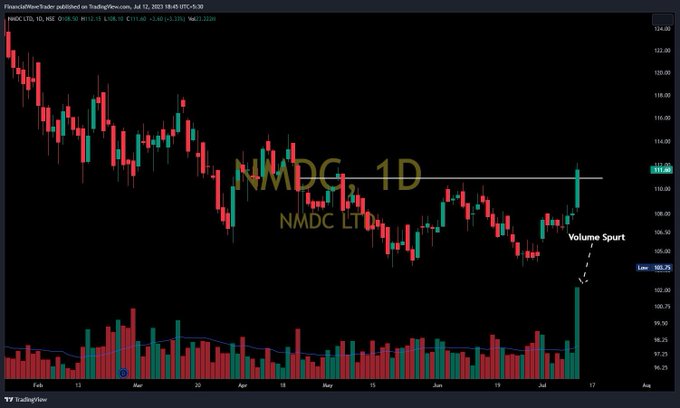
#Stocks
Keep on Radar
#KOTHARIPET
#ADSL
#ASHOKA
#NMDC
#Breakout
and
#BreakoutSoon
Charts by
@WaveFinancial
#Like
#Retweet
for MAX Reach
@TechTradesTT
@WaveFinancial
@GarvModi70
@mystock_myview

2
3
30
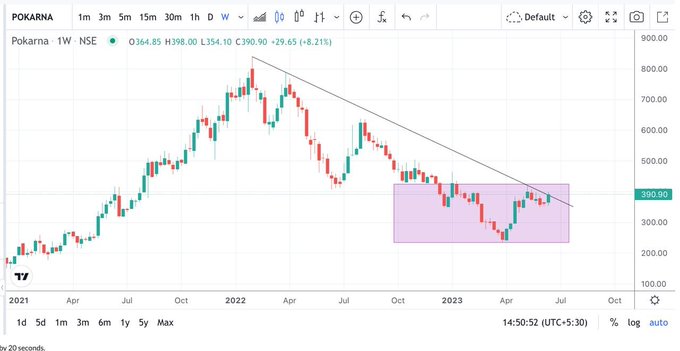
#Like
#Retweet
for MAX Reach
🔰 POKARNA CMP 390
Ready for trend reversal
Looking good for next week
Keep on radar
chart analysis by
@Niteish_14
@TechTradesTT
@WaveFinancial
@GarvModi70
@mystock_myview
@Breakoutrade94
@BakuSarman
@STOCKBAGGER1
1
8
32
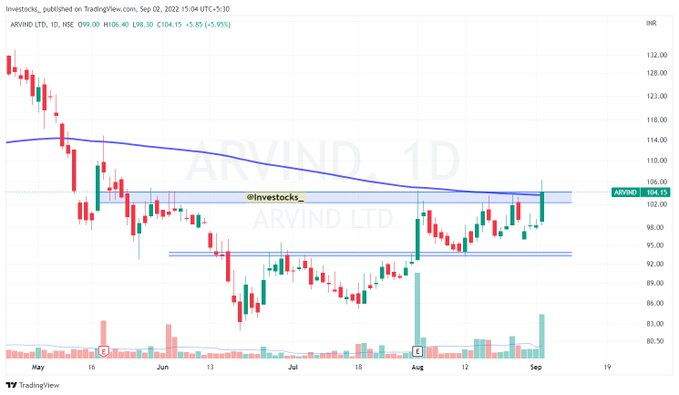
ARVIND LTD.
CMP :- 103.50
➡️ Trying to cross 200 EMA.
➡️ Closing around 105 levels will be good.
MAKE OR BREAK ZONE. 💪💪💪💪
#watchlist
#StockToWatch
from Purvish Kachhadiya
@Investocks_
3
6
31
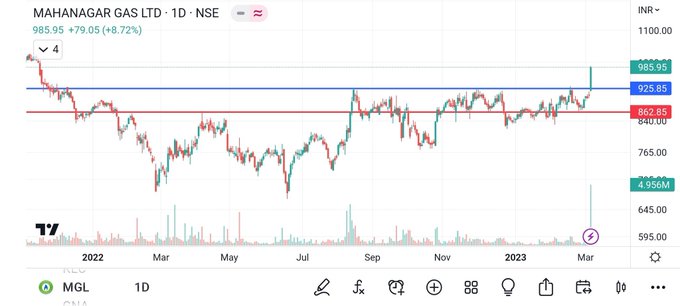
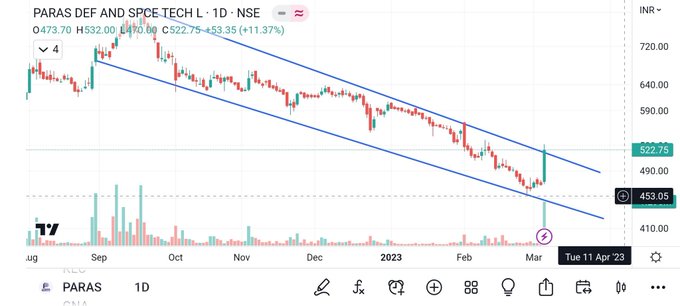
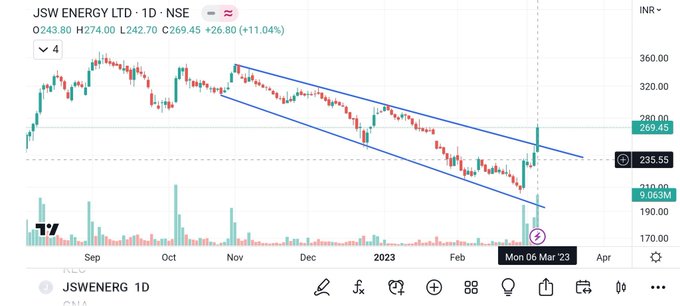
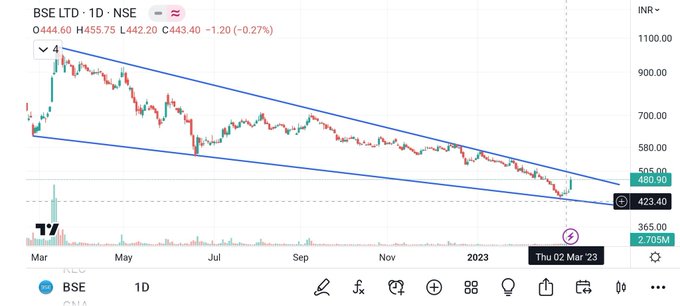
STOCKS TO WATCH
1.MGL
2.PARAS
3.JSW ENERGY
4.BSE
Setups by
@BakuSarman
#LIke
#Retweet
to Show your support for our Experts
#TradingView
#TechnicalTrades
0
7
32
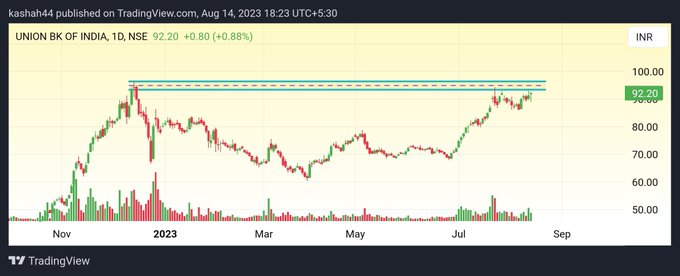
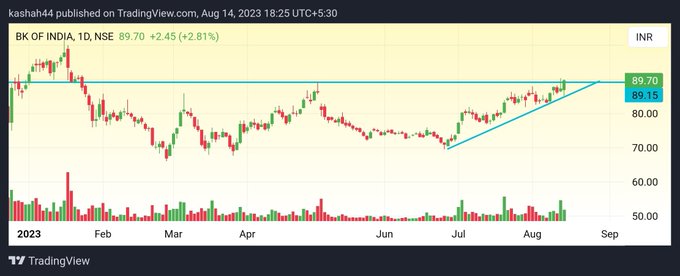
#BREAKOUTSOON
#PSU
#BANKS
Below is a list of PSU banks. Looks good on chart. Must be kept on radar.
1️⃣ PSB
2️⃣ Union bank of India
3️⃣ Bank of India
Chart ideas by
@cakunalshah1983
#stock
#investing
#market
#nifty
#NiftyBank
0
7
32
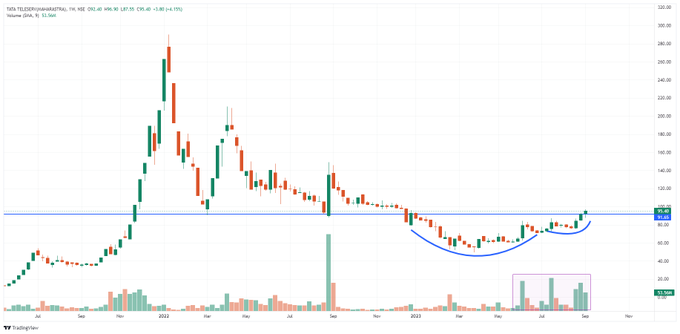
Weekly Stock Idea No. 2 with Naren Joshi
@TechTradesTT
TTML- Cmp 95
✅Weekly Time Frame
✅Crossed a major resistance level with good volume
✅Buyers can keep an SL of 80 for more upside
.
#Like
#Repost
for Next Stock
TELEGRAM Group Link👇
#TradingView
3
8
32
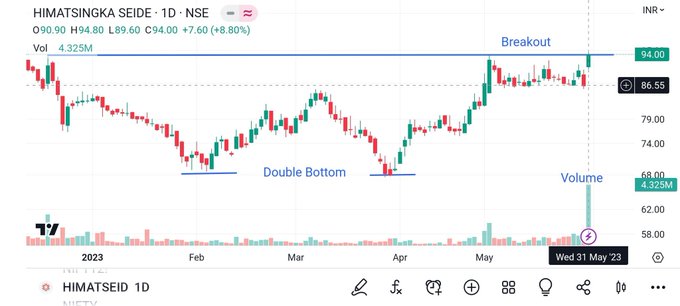
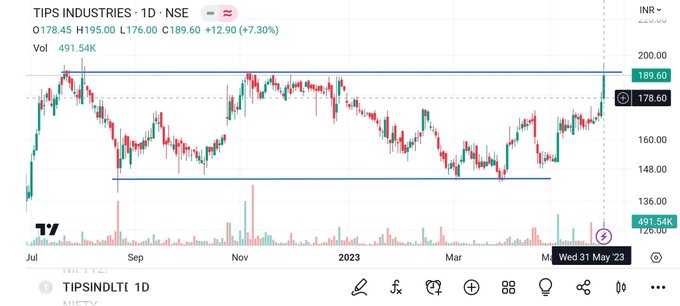
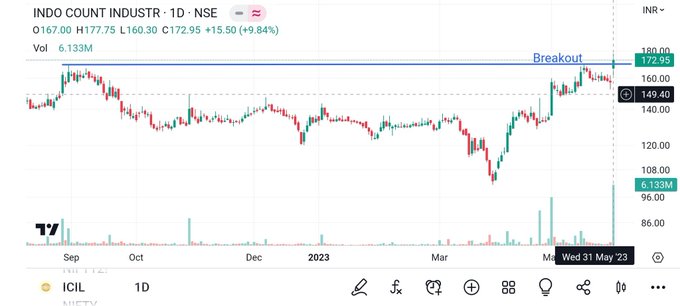
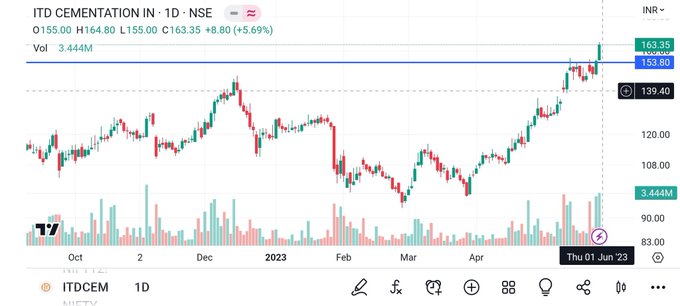
STOCKS TO WATCH
1.HIMATSEIDE
2 TIPS IND
3.ICIL
4.ITD CEM
#StockToWatch
by
@BakuSarman
@GarvModi70
@mystock_myview
@me__kaushik
@TechTradesTT
@WaveFinancial
@Breakoutrade94
2
2
30
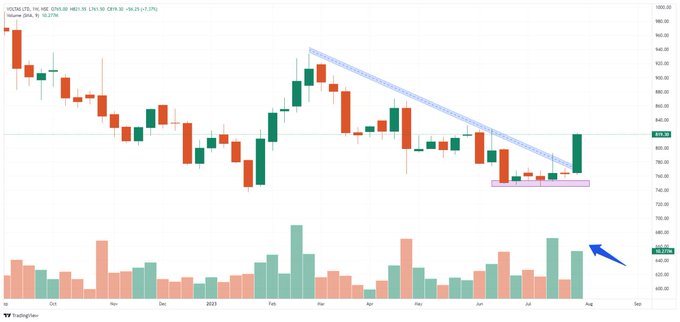
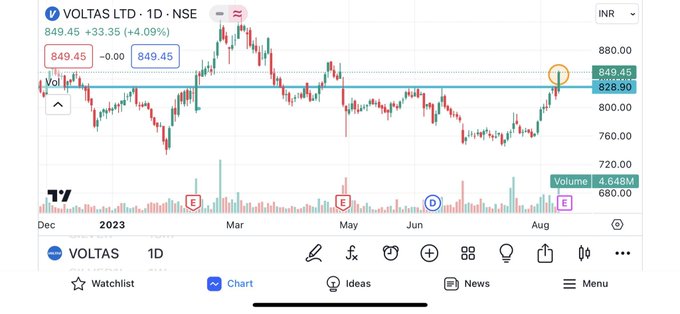
Chart 2 by Naren Joshi
@TechTradesTT
Interesting Chart Setup
VOLTAS - Cmp 819
Weekly Trend Line
#Breakoutstock
Buyer's SL Below 750
Group Link 👇
#TradingView
0
3
31
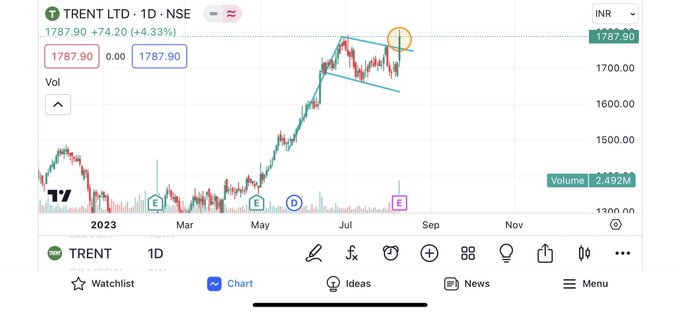
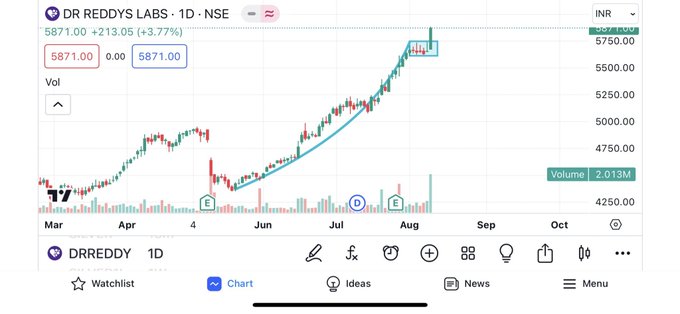
F&O Daily
#BREAKOUTSTOCKS
1) BHARAT FORGE
2) TRENT
3) VOLTAS
4) DR REDDY
Chart Setups by
@GarvModi70
#TradingView

2
2
31
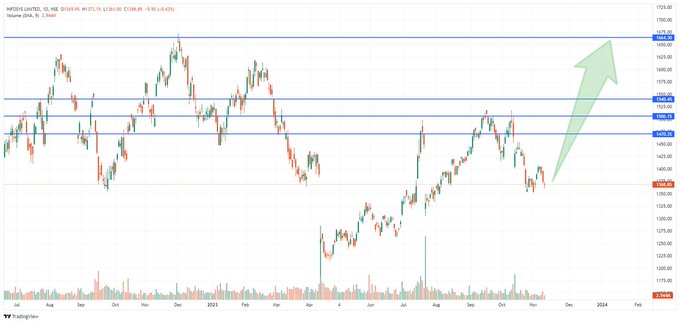
Diwali Special🎇 Top Experts SIP Stock
Stock No. 3-
#Infosys
Targets👇
Motilal Oswal- 1660🧨
Geojit BNP Paribas- 1537🧨
KRChoksey- 1508🧨
HDFC Securities- 1470🧨
Like👍
Repost🔄
Bookmark🔖 for NEXT Stock
#sensex
#Nifty50
#stockmarketindia
#TradingView
#Diwalipicks
0
1
31
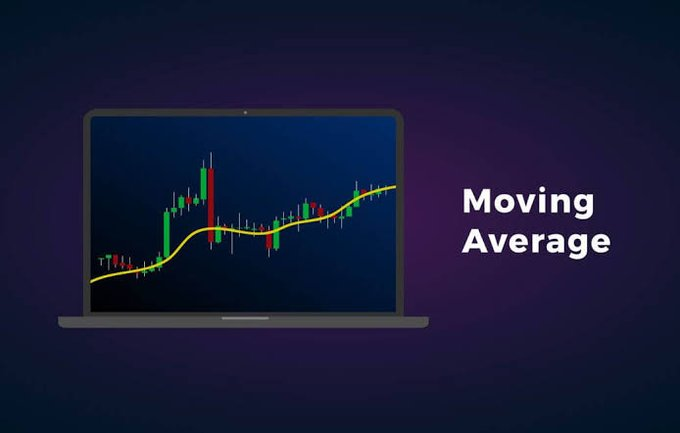
Moving average is one the simplest indicator which many traders and investor use for technical analysis.
𝗔 𝗧𝗵𝗿𝗲𝗮𝗱 𝗼𝗻 𝗠𝗼𝘃𝗶𝗻𝗴 𝗔𝘃𝗲𝗿𝗮𝗴𝗲 🧵 by
@me__kaushik
Retweet ♻ for maximum reach.
3
17
29
🙏 🚀🎊💐🙏
Thanks to All our Experts
We are now 9000+ members family
Keep sharing your High-Quality Analysis 📈📉 & Keep Growing 🫱🫲🫱🏻🫲🏼
@techmental_AK
@GarvModi70
@mystock_myview
@MeghaTrader_MT
@BakuSarman
@cakunalshah1983
@Earner_Sanjeev
@ent_wala
@RICHADICT

15
4
31
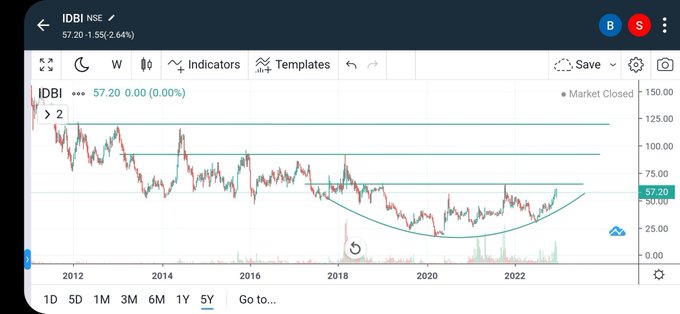
#IDBIBank
analysis by
@ent_wala
A PSU bank
Bank's fundamentals are improving and expecting excellent results in next two quarters
CMP: 57
My targets : 65➡️92➡️120➡️200
#TradingView
Not a buy or sell recommendation
1
6
30
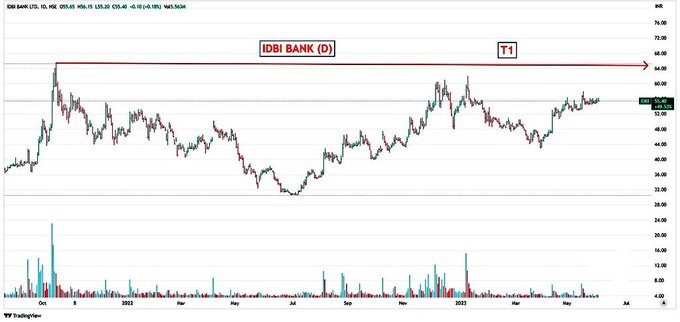
#BREAKOUTSTOCKS
Keep on radar above 58 DCB✅
#IDBI
🎉
Stock Chart views by
@STOCKBAGGER1
#Like
#Retweet
for Next stock idea💡
@GarvModi70
@mystock_myview
@me__kaushik
@TechTradesTT
@WaveFinancial
@Breakoutrade94
@BakuSarman
1
4
31