

Stimulsoft
@Stimulsoft
Followers
279
Following
108
Media
591
Statuses
1K
We develop #reportingtool and #dashboards for #angular | #python | #js | #aspnet | #wpf | #netcore | #net | #blazor | #avalonia Find us at https://t.co/zNnalO7Jti
Estonia, Tallinn
Joined April 2009
Stimulsoft Reports, Dashboards, and PDF Forms 2025.3 is here!. What’s new in this version?.- Script support in Interpretation mode;.- Stimulsoft BI Server can be run in a Docker container;.- Enhanced print window. All the details you may find here

stimulsoft.com
The new version of Stimulsoft products for creating reports, dashboards, and PDF forms is available for download. Key updates: launch a report server in a Docker container, support for scripts in...
0
0
1
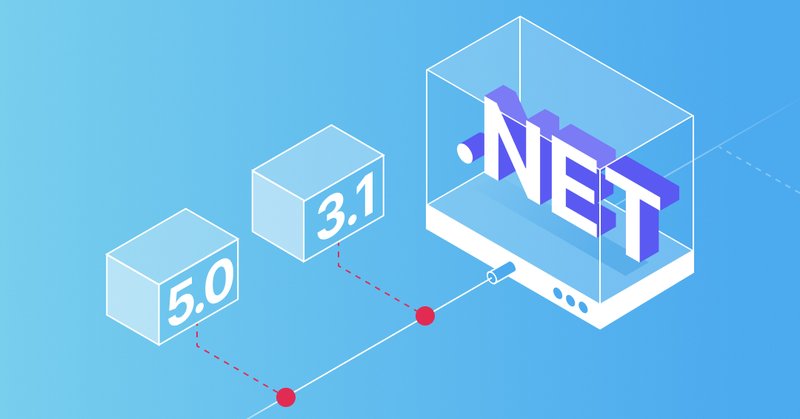
Important update from Stimulsoft regarding .NET Core version support. Full details please find here #NET #NET5 #reportingtool.
stimulsoft.com
Stimulsoft officially announces the end of support for .NET Core 3.1 and .NET 5.0 in reporting and dashboard products.
0
0
0

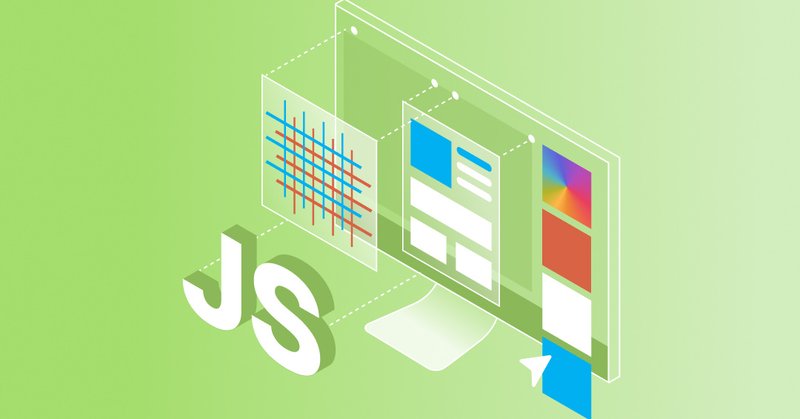
Themes for the report designer and viewer in JavaScript products. Discover how to customize the look and feel of your report and dashboard designer and viewer with themes. All this with just a few lines of code. The full article you will find here
stimulsoft.com
Customizing the user interface theme in Stimulsoft products for reports and dashboards creation in JavaScript, as well as in React, Vue.js, and Angular applications and services.
0
0
0
A new online maps provider for our dashboards!. Learn more about what has changed and how this may affect your projects.

stimulsoft.com
New map provider for the Online Map element. Starting with release 2025.3, Stimulsoft products will use OpenStreetMap.
0
0
1
Report thumbnails. Do you want to know a quicker way to navigate and preview reports? Check out our latest article on Report Thumbnails and see how they can simplify your work with reports!. Read the article -

stimulsoft.com
Thumbnails (previews) for reports, dashboards, and PDF forms in Stimulsoft products and services. How to create, replace, and customize them.
0
0
0
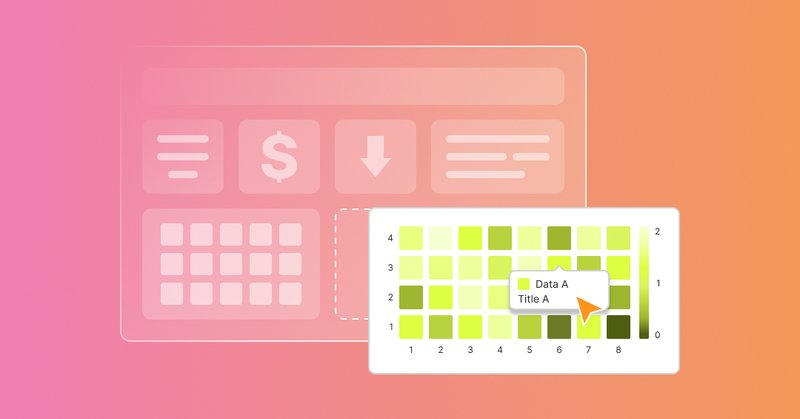
The InclusionMode property for filter elements in dashboards. Discover how this feature gives you more flexibility in displaying and managing data in dashboards. Read the full article -

stimulsoft.com
The InclusionMode property was recently introduced in Stimulsoft components for filter elements in dashboards.
0
0
0
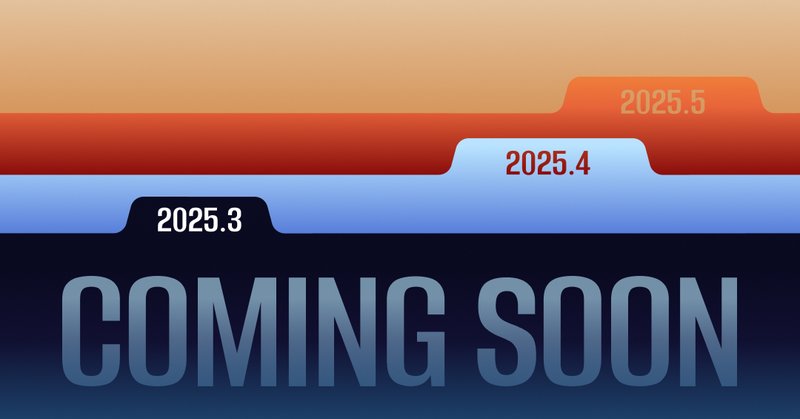
New version 2025.3 is coming soon. A bundle of useful new features is on the way!. Read here - #reportingtool #dashboards.
stimulsoft.com
New features in version 2025.3: running BI server in a Docker container, Join Type connection parameter, C# scripts for Interpretation, and much more.
0
0
0

Fonts in Stimulsoft JS components. Check out .our latest article - it answers all these questions and more!. #reportingtool #javascript.
stimulsoft.com
Discussing the availability, usage, and rendering of various fonts in Stimulsoft JS components.
0
0
0
Yeeahhh, we did it! We have won the Top 50 Publisher Award at the ComponentSource for 2025!. Thanks to @ComponentSource for being an amazing partner!.

stimulsoft.com
We have won the Top 50 Publisher Award at the ComponentSource for 2025! Thanks to all!
1
1
2
New video📹. Python (Flask): Customizing the appearance of the Stimulsoft Viewer in a Python application.via @YouTube

0
0
0
Using the JoinType relation parameter when creating dashboards. Interested? Read the article here #reportingtool #dashboards.
stimulsoft.com
In version 2025.2.2, Stimulsoft products introduced the JoinType relation parameter, which defines the type of join between two data sources in a dashboard.
0
0
0
New article alert: Dynamic assembly loading. What to know more? Check it out now!. #NET #AppDomain #Reportingtool.

stimulsoft.com
Features of loading Stimulsoft assemblies in .NET projects, potential issues that may arise, and possible solutions.
0
0
0
Python (Flask): Saving the report from Stimulsoft Designer on the Server Side in a Python app.via @YouTube

0
0
0
Heatmap Chart. We have recently added the Heatmap chart, making data analysis more visual, faster, and more convenient than ever. Read the full article here
stimulsoft.com
The use of the Heatmap chart in reports and dashboards for simple and intuitive data analysis.
0
0
0
📹New video!. Python (Flask): Changing the localization of the Stimulsoft Viewer in a Python app. via @YouTube

0
0
0
Python (Flask): Activating the report viewer in a Python application [2025] . via @YouTube . #Python #reportingtool

0
0
0
Exciting news for developers! Stimulsoft Reports, Dashboards, and PDF Forms just got even better with the 2025.2 update!. Check out the full details and see how they can boost your report design workflow!. #BI #reportingtool #Java.

stimulsoft.com
Stimulsoft Reports, Dashboards, and PDF Forms 2025.2 release includes updated versions of components for React, Vue.js, Angular, a new Macro PDF417 barcode type, the ability to use Blockly in...
0
0
1