
Salomé Esteves
@RSalomeEsteves
Followers
225
Following
810
Media
200
Statuses
361
Teaching DataViz + Infographics at @FAULisboa / Data and visual Journalist at @Renascenca / Volunteering at @DatavisLisboa / bookworm / bad feminist 🍕🍷📚
Lisbon, Portugal
Joined December 2012
RT @SondagensRR: 📊Em 2022, as mulheres votaram, pela primeira vez, mais à esquerda do que os homens e as sondagens de 2023 mostram que há m….

rr.pt
Em 2022, as mulheres votaram, pela primeira vez, mais à esquerda do que os homens e as sondagens de 2023 mostram que há margem para o padrão continuar. A tendência veio para ficar? É preciso esperar...
0
2
0
RT @hellopeiying: Taking advantage of the fact that #InfoPlus2023 just wrapped up -- in a few weeks my colleagues will be rolling out invit….

lapis-story.com
Turn data and research into a visual and impactful story. Lapis makes data storytelling easy—no fancy tools needed.
0
1
0
Took my favorite DataViz book of the year out for a swim *.
#SummerBreak share #3:📚🌞@RSalomeEsteves brings #DataViz to the pool, showing summer's not just for rest but also prep. "Making with Data" expands Data Visualization into art, engaging the senses. "So far, it is a fascinating read." ✨

0
0
8
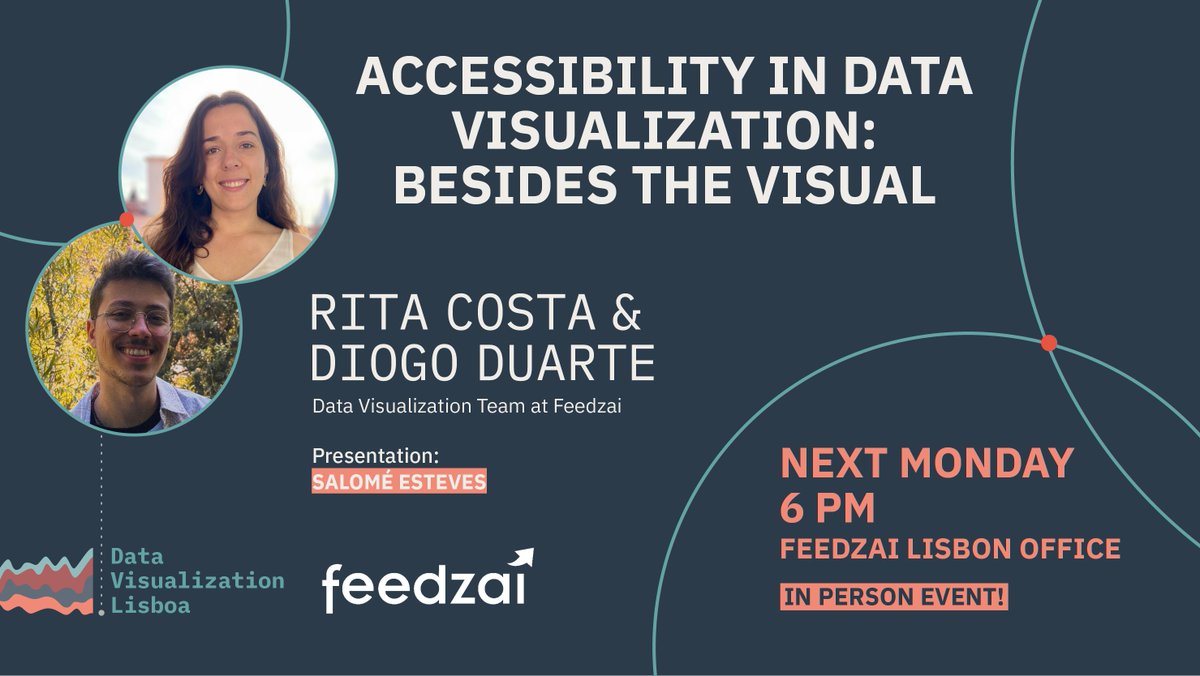
Daqui a nada é segunda-feira e onde vamos estar? Na Feedzai a falar sobre Visualização de Dados e Acessibilidade! 🤓.
Next Monday will you join us at Feedzai for another in-person event? 🙌 It's free to attend, but you do have to register here:
0
0
2
Quarta-feira é dia de ir à Covilhã falar da convergência entre Design, Storytelling e Visualização de Dados ✨.

@itnewspt and @UBI_pt are inviting @RSalomeEsteves for a lecture on #Design and #Storytelling in #DataVisualization. 👁️View the event here:

1
0
7
Wait. What? 🤯🤩 This might be life-changing for data and visual journalism. Truly having the nerdiest party in my head 🤓.

Ready to unravel all these layers of possibility? Sign up to be one of the first on our platform or help us shape our tool as an alpha tester – more details here:
0
0
1
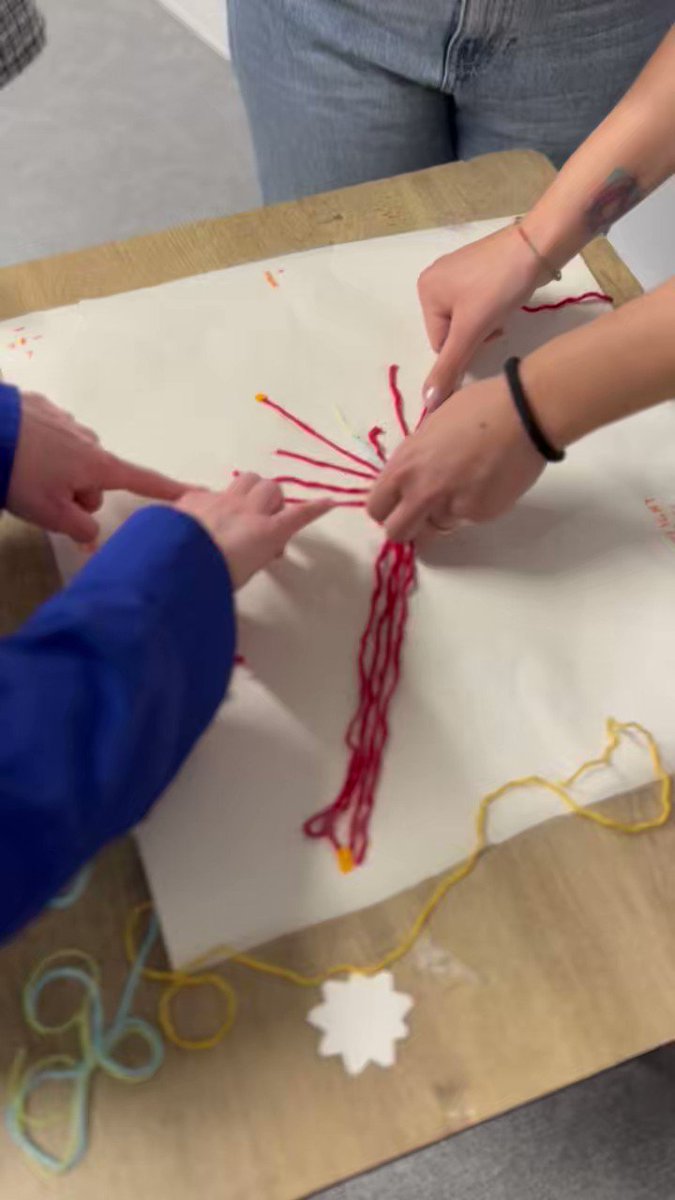
RT @ZeeVizGirl: "Get to know your peers with Data Physicalisation" was @RSalomeEsteves's hands-on & playful workshop to create handcrafted….
0
5
0
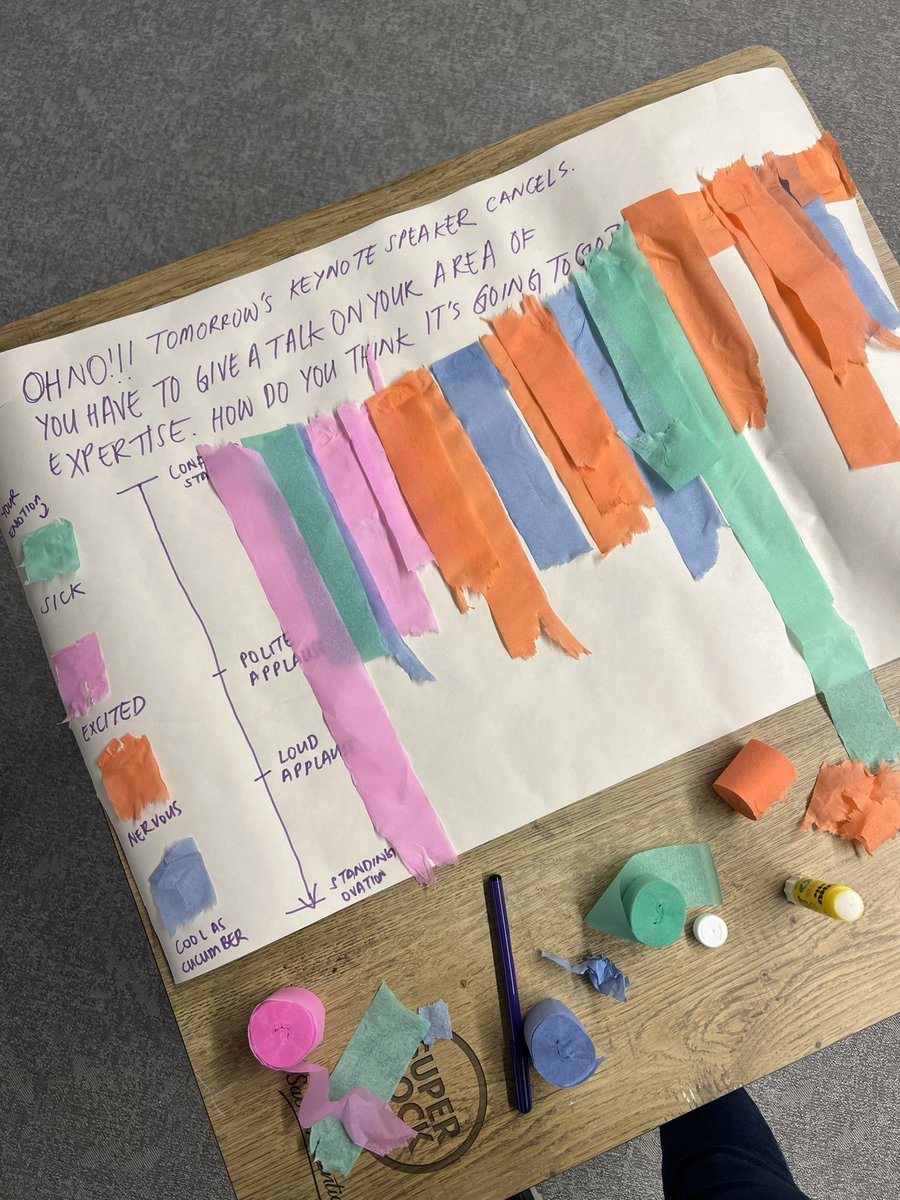
I was very scared of doing a data physicalization activity in less than a hour, by @hellopeiying is right: data vis people are incredibly creative and rose to the challenge! 💪✨ Thank you @OutlierConf, @DataVizSociety and, of course, @DatavisLisboa 🤓.

Wrapped up day 1 of @OutlierConf with a data physicalization activity that was so much fun!! Taking so much inspiration from this for workshops with both adults and kids. Also clearly data people are so talented — this is what we came up with in < 30 mins.


2
6
28
RT @fndViT: @ZeeVizGirl @Diogo_Camilo41 @xocasgv and @NenoRoi did this for @RSalomeEsteves’s workshop at @OutlierConf #outlier2023
https://….
0
2
0
RT @Jasonforrestftw: I'm delighted to share Clayton Whitehall's 1955 "The Wild Flowers of Spring" map again! Isn't it lovely? https://t.co/….
0
9
0
It was such a joy to be able to do a meetup in person 🤓 We wrote a little summary of what we learned from our guests, so you don't miss all of it!.
If you missed our in-person event on #gendergap & toponymy with @joaobernarciso and @ManuelBanza, here's a chance to get a taste of how it was like. Thanks to those who joined us, it felt good to be back🙌! #dataviz #DataVisualization.
0
1
1
RT @HelderVFontes: O @ManuelBanza é excelente no que faz. Para a minha rede de Lx, vejam isto. E claro, só poderia ser na @mensagem_lisboa….

amensagem.pt
Escolhida uma morada, o novo mapa permite explorar tudo o que está dentro da sua cidade dos 15 minutos - a pé ou de bicicleta.
0
5
0
RT @NewYorker: “That Netflix can predict what you want to watch, that Google knows which sites to serve you—these miracles are the result o….

newyorker.com
We’ve uploaded everything anyone has ever known onto a worldwide network of machines. What if it doesn’t have all the answers?
0
62
0
I had so much fun today hosting the last event of @DatavisLisboa 's Latin America Special Season, which was a round table about Data Vis in Portugal and Brazil! * Thank you so much to everyone who joined us in the last few months. It was a joy 🤗.
#37 Visualização de Dados em Língua Portuguesa: Mesa Redonda c/ DataVis Rio
0
0
3

RT @DatavisLisboa: Já faltam poucos dias para a mesa redonda que vai fechar o Especial América Latina do Data Visualization Lisboa! Adicion….
0
1
0
I had an awesome time yesterday with @HasselFallas talking about her work at @La_data_cuenta 🤗.
#36 Hassel Fallas: Data and visualization at the service of climate change evidence
1
0
6
RT @PublicDomainRev: Book from 1911 showing that taking photos of cats and furnishing them with an amusing caption is far from being a phen….
0
4K
0
Everyone who knows me knows that teaching is my favorite thing in the world 💡🤓 And because I always learn so much from my students, I had to put my biggest lessons into writing ✨ This to say: my first article for Nightingale has come out 🙌.

After she'd been teaching for a while @RSalomeEsteves found that, despite the wide range of students, there were some topics that always came up. Check out the five conversations (and advice) she has every year with her #dataviz and infographics students.
0
0
4
It was a joy to talk with María and Pablo from La Nación! Make sure you don't miss out on their amazing Data and Journalism projects 🤗.
María Rodríguez-Alcobendas and Pablo Loscri - From Ink to Pixels. How a Traditional Newspaper in the Southern Tip of the World Transformed into a Digital Storytelling News Site with Design Perspective
0
0
2