

Playfair Data
@PlayfairData
Followers
4K
Following
169
Media
743
Statuses
890
Playfair Data turns raw data into valuable insights. Tweets curated by William Playfair – inventor of the bar chart, line graph, and.... pie chart.
United States
Joined February 2018
Our KC team was back at Children’s Mercy Hospital this month – this time sorting, packaging, and labeling donated clothing for children and families staying at the hospital. Thank you, @ChildrensMercy, for all you do for so many people in our community. ❤️ Learn more about

0
0
1
Starting four weeks from today! Learn Tableau and visual analytics directly from the author of Practical Tableau, earn your Visual Analytics Apprentice credential, benefit from a year of Playfair+ membership, and more. Learn about the May 14-17 training: https://t.co/rWQ5LaqQbZ

0
0
2
Atlas, the Playfair+ member exclusive visual analytics catalog, features 21 chart types and 73 variations, all with historical context, best practice tips, and links to expert-led tutorials. Atlas is available now for all Lifetime Playfair+ members. Learn more:

0
0
2
Did you know? Playfair Data’s Orlando office building, affectionately known as the ‘Jewel Box’, features an abstract chart that lights up at night and changes colors throughout the year. It’s an awe-inspiring reflection of the power of visual analytics.

0
0
4
While our company’s namesake, William Playfair, invented some of the most effective chart types in use today, data encoding and its inspirations can be traced back thousands of years. Learn the fascinating history of data visualization in Sr. Manager of Information Design, Alyssa
0
0
1
A lot is on the line this week. Our team has crunched the numbers, built their brackets, rooted for the underdogs, and been on the edge of their seats throughout the Women’s and Men’s NCAA tournaments – all to find out who will take away the inaugural Malachite Kingfisher

0
0
2
A KC 3peat? Sign us up. Thank you to our clients, Playfair+ members, and team for landing Playfair Data on the @KCBizJournal's list of fastest-growing technology companies for the third straight year.

0
0
5
Understanding a data set’s level of granularity is one of what we call the “Big 3” of analysis. In his new tutorial, Director of Analytics Engineering, Ethan Lang, shows you how to understand and even control the level of grain with his Beginner's Guide to Tableau Level of
0
1
6
With our dual visual analytics consulting and training business model, we have a lot to share. That’s why with our forthcoming site updates, we’re making it easier than ever to find the resources that are most relevant to helping you turn your data into value.

0
0
2
Thank you, Ingram’s Magazine, for recognizing Playfair Data as one of KC’s Best Companies to Work For. Learn more: https://t.co/3BeFQWWkx1

0
0
1
New Course: In his latest video, Tableau Prep Builder Essentials, Senior Data Engineering Associate, Nick Cassara, shows you how to filter, aggregate, union, and more. Watch video: https://t.co/Sc0j42kETx Learn more from Nick: https://t.co/LsNDdSPmVB
#tableau #dataengineering
0
0
3
⭐⭐⭐⭐⭐ “I would have paid much more for your training, to be honest.” Yeah… we get that a lot. Visual analytics has positively transformed our business, lives, and the community around us, so we’re proud to continue providing our public Tableau training events at an

0
0
3
Combining data sources is like an analytics superpower.⚡ In her latest post, Associate Director of Analytics Solutions, Felicia Styer, shares how easy it is to get more from your analyses using Tableau relationships. Read post: https://t.co/gsuwtCn98H Learn more from Felicia:
0
0
2
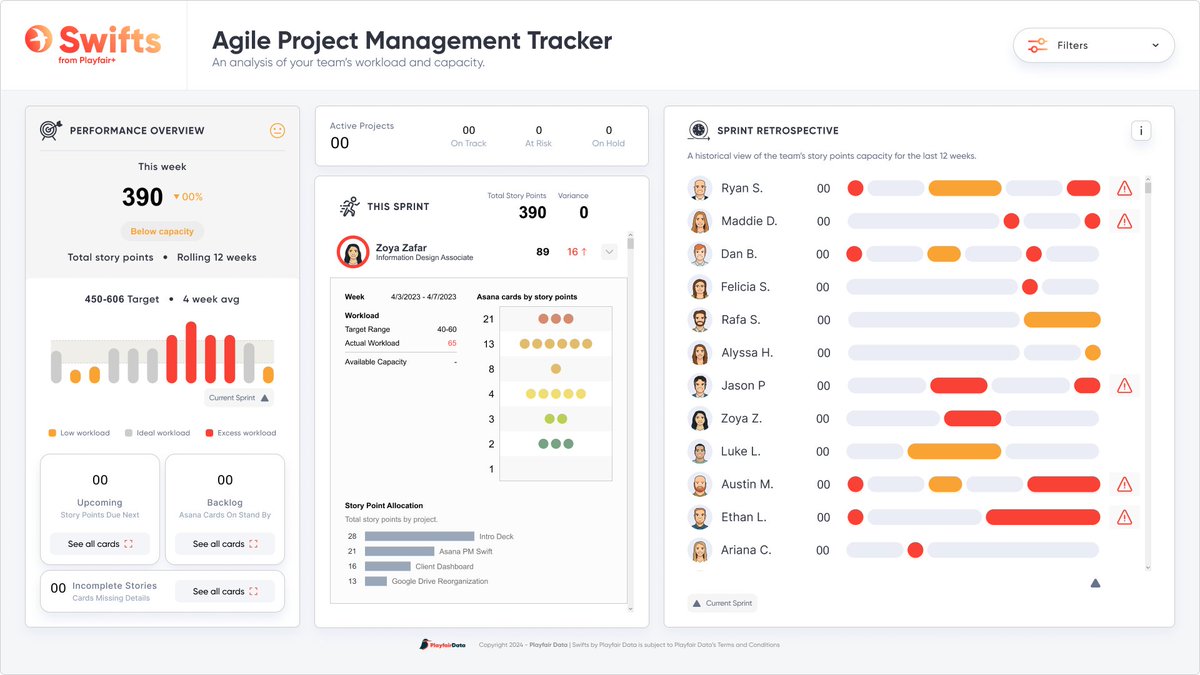
Got big Q2 project plans? Playfair+ has you covered with the Asana PM Swift. Simply download the dashboard template, follow the included documentation to populate your data, and make your project management a breeze. Available now for all Lifetime Playfair+ members on your
0
0
9
One of the many perks of our Orlando office is we can look towards the coast and literally see rockets being launched into space. It’s truly an inspiring symbol of what’s possible through (out of this) world-class strategy, design, and engineering. 🚀

0
0
4
In his 1983 book, The Visual Display of Quantitative Information, Edward Tufte warned us of the dangers of using “chartjunk”. Fortunately, Manager of Information Design, Rafael Simancas, is here to show you how to trade distracting chartjunk for value-adding dashboard images

0
1
6
Playfair Data is proud to sponsor the UCF Big Data Analytics Symposium for the fourth consecutive year. This year we’re on a mission to recruit the next generation of world-changing visual analytics practitioners across data prep, design, and dashboard engineering. Learn about

0
0
5
What better way to celebrate Pi Day than with a treat from our downtown Overland Park neighbors, The Upper Crust. Let us know if you’re in the neighborhood – we’d love to show you around! Oh, and if you want to learn about pie charts, of course we have you covered:

0
0
2
Live virtual Tableau training with the best-selling author of Practical Tableau is back! Now’s your chance to learn directly from industry-leading experts, access hundreds of post-training resources, and more. Learn more: https://t.co/rWQ5LaqQbZ Book your spot:

0
0
2
New tutorial: Manager of Decision Science, Maddie Dierkes, demystifies TabPy and shares three use cases for integrating Python with Tableau. Read the quick start guide to TabPy: https://t.co/s7qlMKXdx6 Learn more from Maddie: https://t.co/jlh7YH50Mj
#tableau #python #data
0
0
1