
NWS Chicago
@NWSChicago
Followers
143K
Following
14K
Media
27K
Statuses
47K
Official X account for the National Weather Service Chicago. Details: https://t.co/WJlrehRT4n
Romeoville, IL
Joined July 2012

While there won’t exactly be great beach-going weather, if you have plans to go to a northwest Indiana beach any time this evening through tomorrow (Thursday) afternoon, know that high waves will lead to dangerous swimming and boating conditions in Lake Michigan waters. #INwx

0
0
4

A16Z SPEEDRUN 2026 UPDATE:.I think most people secretly know if they’re founders or not. Some of you can never be happy working inside a giant company, writing docs, in endless meetings. Deep down, you know you’re supposed to build. we're opening up a16z speedrun today! We are
98
203
927


🚨BUSTED: The State of Texas is suing Big Pharma manufacturer Eli Lilly for bribing health care providers to push their medications. Doctors should prescribe based on patients’ health, not Big Pharma’s payouts,. It’s time to end their game of kickbacks, influence and corruption!.
170
2K
8K


BIG NEWS, Dragon Ball Fans!.Pre-register now and join Goku on day one!.Get exclusive launch rewards and rare items.Will you be the first to experience it?.
1
13
120


Warfighters Chamber of Commerce meeting at Pocono Mountains on Labor Day. When the NJ Veterans attending heard NJ Law Against Discrimination("NJLAD") includes LGBTQIA+, transgender individuals, and even on hairstyles as a protected classes but does not include NJ Veterans as a


4
6
63

[5:00 PM CDT 8/28].With dangerous swimming conditions at #LakeMichigan beaches thru tomorrow aftn, images from: Stay dry when waves are high! When caught in a current: Flip, Float, & Follow!.Beach Hazards Statement in effect until 4pm Friday. #ILwx #INwx


1
4
16

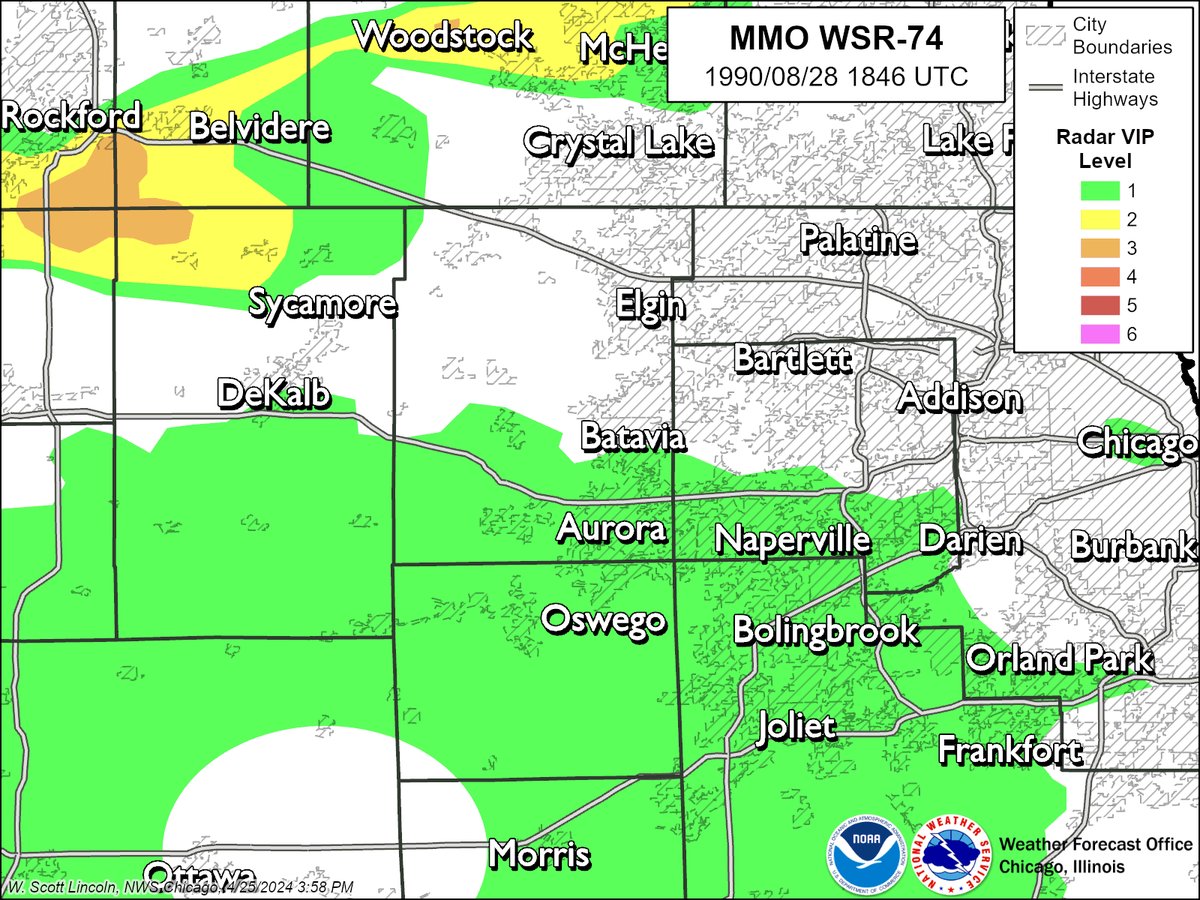
Today marks the 35th anniversary of the devastating 1990 F5 Plainfield tornado, which remains the strongest tornado on record to strike the United States during the month of August. To learn more about this historic event, visit our webpage at:.#tornado


8
105
392

New Quarterly Thesis Pick.Disseminated on Behalf of Questcorp Mining Inc. QQCMF.QQQ,CN (TSX).Long spec Idea 0.12-0.15.Stops .07.Res: 0.22 then 0.3. La Union: High-grade CRD project (up to 83.2 g/t Au, 4,816 g/t Ag, 30% Zn). 3 drill-ready targets; Phase I drilling Q3/Q4 2025.


1
558
582


