
MetricFire
@Metricfire
Followers
139
Following
31
Media
258
Statuses
776
Hosted Graphite as a service with alerts, team sharing, engineering support, and integrations with your tools. Free trial: https://t.co/OLPRODoo2O
Las Vegas, NV
Joined May 2011
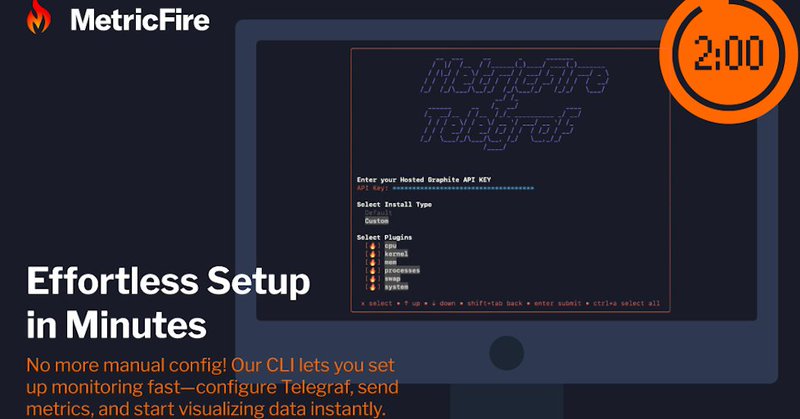
Meet the Hosted Graphite CLI! We spoke with one of our engineers about how this new tool makes monitoring with Graphite easier than ever. Get the inside scoop on features, setup, and more!.Watch now: #DevOps #Graphite #Monitoring #Observability.
1
1
1
Librato & AppOptics will be sunsetted on 30th September 2025. Here's what to do next! . Read the full post: #Heroku #DevOps #Metrics #Monitoring #AppOptics #Librato #Solarwinds #Observability.
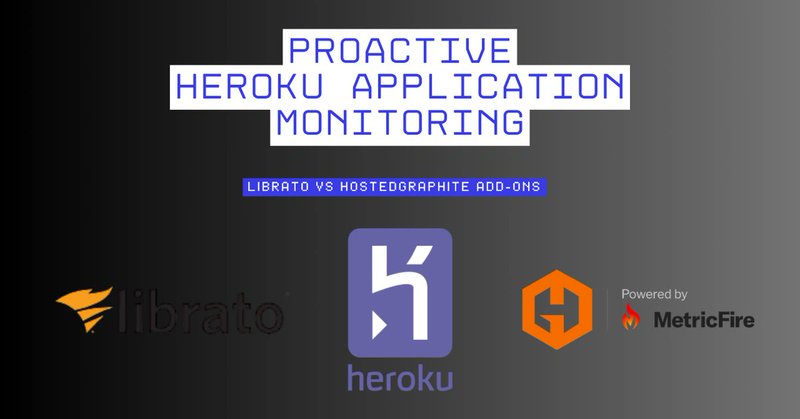
metricfire.com
If you’re serious about your application, you need to be serious about your monitoring. Hosted Graphite gives you the depth, flexibility, an
0
0
0
RIP Librato & AppOptics on Heroku. 🙏.Hosted Graphite is the better next step. Instant setup. Automatic Dashboards out the box.Alerts built-in.Don’t lose visibility into your app’s performance: #Heroku #DevOps #Monitoring #Librato #AppOptics #Solarwinds

0
0
0
Monitoring just your #Heroku app? That’s half the story. Add-ons like Redis, Postgres & Kafka can quietly break things. How to monitor everything on Heroku. Not just your app: #Heroku #Monitoring #DevOps #SaaS #Grafana.
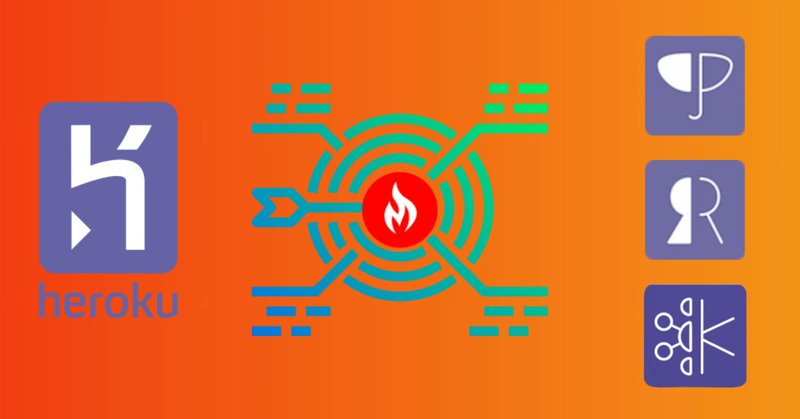
metricfire.com
Monitoring your Heroku stack helps you understand the performance of your application and infrastructure. You can identify bottlenecks, slow
0
0
0
"Excellent services as always!" 💬.Huge thanks to our user for this ⭐️⭐️⭐️⭐️⭐️ G2 review — and props to Ben from our team for the incredible support!.If you need monitoring + real human support, MetricFire has your back. 💪.#DevOps #Monitoring #CustomerSupport #MetricFire.
0
0
0
🚀 New updates from MetricFire!.✅ Faster request handling.📈 Improved memory monitoring for Heroku dashboards.🛠️ One-click CLI install command.📘 Clearer onboarding & docs.Simpler setup. Smoother monitoring. Try it now #DevOps #Monitoring #Heroku #Grafana.
hostedgraphite.com
Sign up for a free trial of Hosted Graphite - 14-day free trial. No credit card required
0
0
0
“From Logs to Metrics (Part 2)” shows how to build a clean, open-source pipeline with Loki, Vector & Graphite: Huge props to our engineer for the research & write-up. 👏. #DevOps #Observability #OpenSource #LogsToMetrics #Graphite #Loki #Vector.
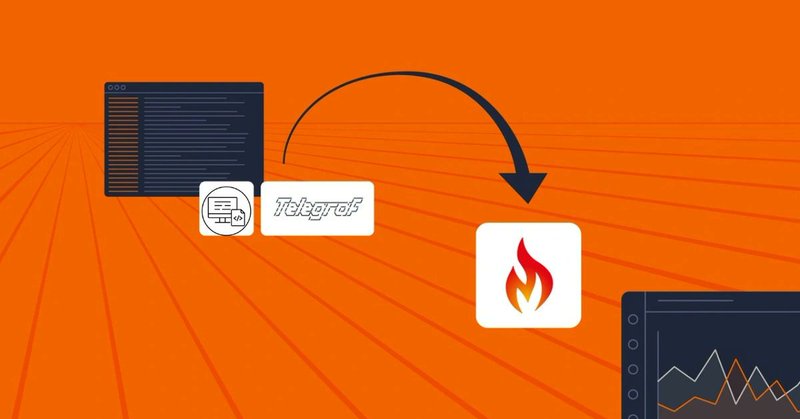
metricfire.com
In this guide, we'll show you how to transform some raw logs into usable metrics using a lightweight, open-source setup. We'll also use the
0
0
0
New visual updates at MetricFire! .✅ Better responsiveness across screen sizes.✅ Fresh SVG logo.Smoother, cleaner, faster. Try it now → .#DevTools #Monitoring #UIUX #MetricFire.
hostedgraphite.com
Sign up for a free trial of Hosted Graphite - 14-day free trial. No credit card required
0
0
0
Managing your own monitoring stack? 🥵. MetricFire makes it easy to see your whole infrastructure at a glance. Less stress, more insights. #DevOps #Observability #SRE #MetricFire

0
0
0
Observability with OpenTelemetry + Carbon Exporter . Run otelcol-contrib as an agent to collect system metrics and export to Graphite-compatible backends. No extra dependencies needed. Full setup guide: #OpenTelemetry #DevOps #Observability #Metrics.

metricfire.com
Using OpenTelemetry Contrib as an agent makes it easy to collect and forward system performance metrics without needing multiple monitoring
0
0
0
We just launched the Monitoring CLI on @ProductHunt!.One command = instant system metrics. Built for DevOps. Powered by Hosted Graphite. Every bit of support means the world: #ProductHunt #Observability #DevOps #Grafana #Monitoring #CLItools.
producthunt.com
MetricFire is a fully hosted monitoring platform built on Graphite and Grafana, helping you collect, store, and visualize time-series data from any source.
0
0
0
We built a Hosted Graphite CLI tool to manage metrics faster & easier. Watch the team interview to learn more:. .#DevOps #Observability #CLI.
0
0
0
Join us for an in-depth discussion with our Engineer MetricFire as we explore how the CLI command-line utility makes it easier than ever to manage Graphite metrics:
docs.hostedgraphite.com
Our recommended command line tool that's fun and easy-to-use - for installing and configuring agents in your systems.
0
0
1
Check this out!.

We've upgraded status metrics in Hosted Graphite! .Now, status codes are dynamically reported for more detailed & accurate monitoring. Stay on top of your app’s performance. #Monitoring #DevOps #MetricFire #Observability.
0
0
0
RT @HostedGraphite: We've upgraded status metrics in Hosted Graphite! .Now, status codes are dynamically reported for more detailed & accur….
0
1
0
Want to try a better monitoring experience? Sign up for a trial!
hostedgraphite.com
Sign up for a free trial of Hosted Graphite - 14-day free trial. No credit card required
0
0
0
We made a CLI tool to send system metrics straight from your terminal. Easy-to-install. and no need to edit config files. Get started: Why we made it: Try it out & let us know what you think! .#DevOps #CLI #Monitoring #Observability.
metricfire.com
We are happy to announce our latest project at MetricFire: a brand-new CLI tool! Get ready to start monitoring your systems in one step!
2
0
3
Curious how to monitor NGINX? This article shows you how!. Easiest Way to Monitor NGINX Performance with OpenTelemetry. #NGINX #OpenTelemetry #MetricFire #PerformanceMonitoring.
0
0
0