

mattbrehmer
@mattbrehmer
Followers
2K
Following
3K
Media
223
Statuses
1K
assistant professor, computer science, university of waterloo, now at mattbrehmer (dot) bsky (dot) social
mattbrehmer.bsky.social
Joined November 2007

👏🏻 kudos to @NElmqvist and his students for sharing popular science articles based on recent #visualization research papers! . …great to read about my work from a new perspective (thanks Claire!). idea for a fun extension: summarize a @ieeevis paper as an insta story or TikTok.

@jlrulff @fabiom_miranda @_mlage @markbcartwright @grahamdove @csilvanyc @w_epperson @dorisjlee @leijiewang17 @adityagp @domoritz @adamperer @Birdbassador @vizstudylady @ieee_tvcg @crescentiajung @YuhangZhao1 @YeaseulKim Should data analysis be a jam session or an orchestra hall recital? Claire Niemeier has the answer with her summary of this great paper on communication and collaboration by @mattbrehmer and @eagereyes. 17/.
0
0
8
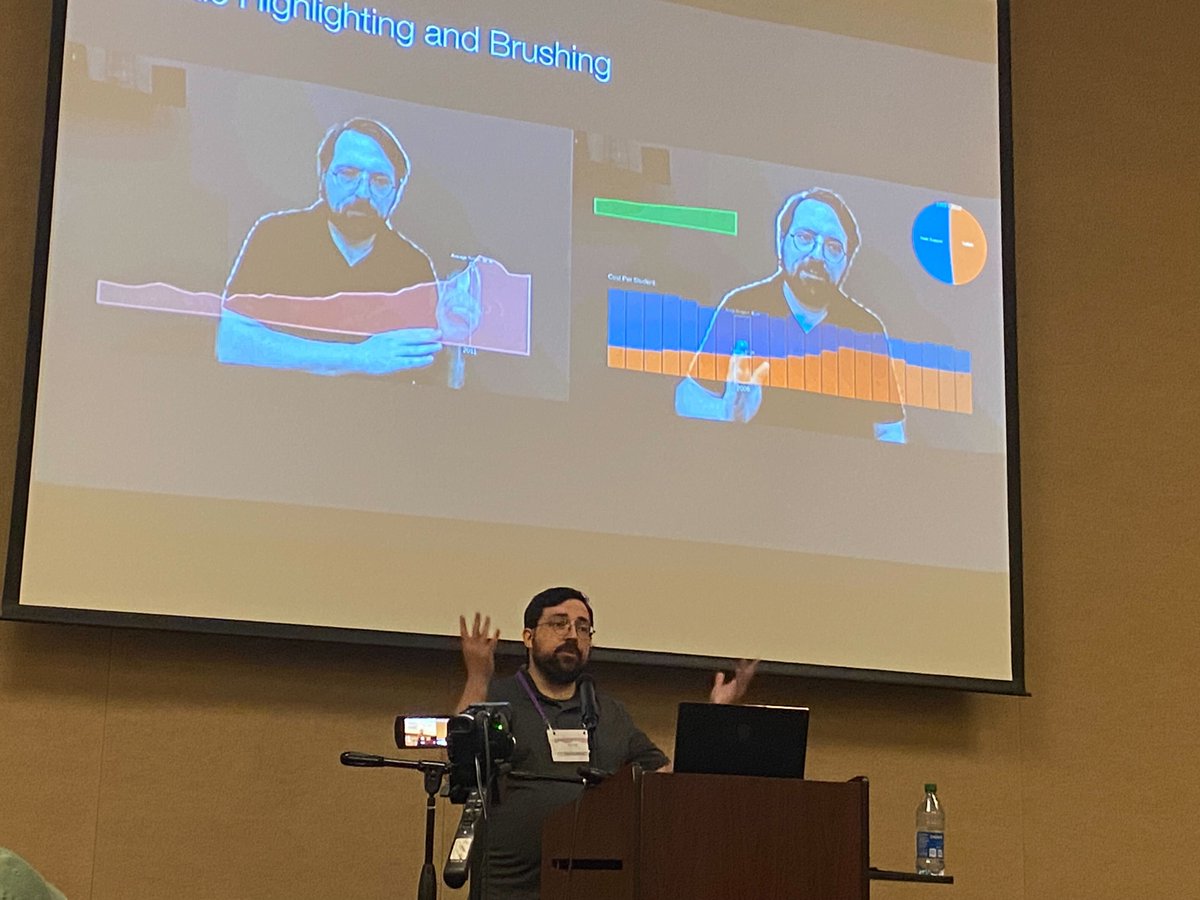
2021-22 @tableau research intern and @umsi PhD student Brian Hall ( speaking about our work at #UIST2022…. ironically an in-person talk about remotely presenting data to remote audiences with interactive #visualization overlays.
0
3
21
RT @vsetlur: @mattbrehmer from Tableau, along with co-authors.@lynbartram and Brian Hall present their work, "Augmented Chironomia for Pres….
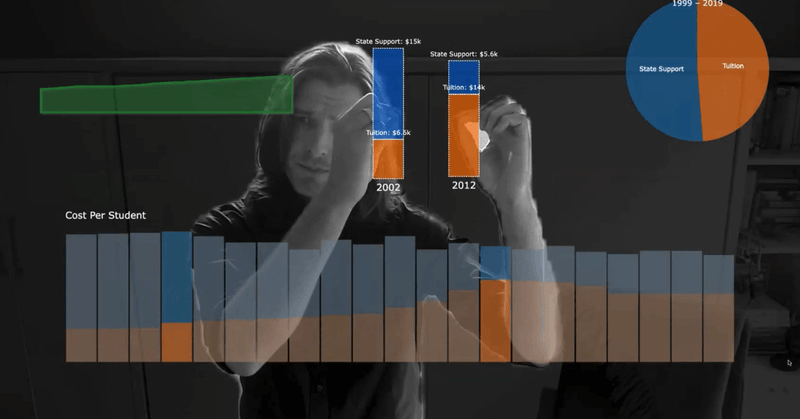
tableau.com
Tableau Research leaders demonstrate the ability to interact with viz overlays by simply pointing at them in live webcam video.
0
2
0
RT @Elijah_Meeks: The real damage Tufte did to data visualization has nothing to do with data-to-ink ratio. Instead it was creating this he….
0
8
0
"If students in engineering only learn how to draw CAD diagrams, they’re not actually thinking visually, they’re hacking…". – #ieeevis capstone speaker Kerry Magruder paraphrasing an engineering professor introducing students to the basics of perspective drawing.
0
2
7
"Pedagogically, what is your equivalent of the artisan workshops of Tuscany? Is this conference something similar?". – Kerry Magruder, #ieeevis capstone speaker.
1
2
10
RT @10_arjun: ✨ New @tableau research project on using recommendations 🤖 to help people compose #visualization #dashboards 🔢📊📉:. MEDLEY: In….
tableau.com
0
3
0
a pre-print of the related #uist2022 paper "Augmented Chironomia for Presenting Data to Remote Audiences." is available at and the accompanying video is available at
0
1
4
Our research project will also be presented and demonstrated at #uist2022 later this month, where our paper will also be recognized with an Honorable Mention Award 🎖.

Augmented reality could change how you present data virtually. Tableau Research team @mattbrehmer, @lynbartram and Brian Hall demonstrate touchless interaction with viz overlays, pointing at them in live webcam video.
1
2
24
RT @vsetlur: Tableau Research is looking for amazing interns to join us this summer of 2023. We are looking for Ph.D. students who work in….
0
48
0
RT @vsetlur: We are hiring at Tableau Research! Looking for early/fresh grads to come join our team! Areas include applied ML/NLP/AI, and H….
0
81
0
👉 new project from @tableau research! . Presenting data to remote audiences w/ interactive 📊 #visualization overlays + 🙌 hand tracking. by B. Hall (, @lynbartram, + myself. 📄 to appear at #uist2022: . 🎦
8
23
210
Sad to see this end, and fortunate to have been able to attend in 2019, which was the most memorable and inspiring forum for sharing ideas that I've attended. Thanks @eyeofestival organizers!.
0
0
2
RT @tableau: On the blog, Tableau technical evangelist @acotgreave looks at chart examples across social media and shares his best practice….

tableau.com
Tips and tricks on how to design charts and visualizations to share in social media.
0
17
0
RT @theneilrichards: @cheeky_chappie @ZachBowders @DataVizSociety Early career advice, huge @SlackHQ community, fireside chats, @OutlierCon….
0
1
0
Yesterday I chatted with an insightful trio (@FrankElavsky, @kekewu728, @abmakulec) about presenting #visualization to an audience, the related #a11y implications, and the lasting impact of Hans Rosling. see the recording via @DataVizSociety's youtube:
0
5
14
RT @FrankElavsky: Hey! This is later today! Mark your calendar/set a reminder and hang out. I'm super excited to join the wonderful @kekew….
0
2
0