

$Trader
@GDXTrader
Followers
12K
Following
9K
Media
23K
Statuses
35K
Experienced and veteran stock trader who specializes in mentoring gold and commodity traders, focusing on technical analysis. Discord https://t.co/gNHZigJIBw
Canada
Joined August 2010
𝐆𝐨𝐥𝐝𝐞𝐧👁️ - 𝐏𝐫𝐢𝐜𝐞 𝐏𝐚𝐲𝐬 - 𝐋𝐞𝐚𝐫𝐧 𝐓𝐨 𝐅𝐨𝐥𝐥𝐨𝐰 𝐈𝐭. We keep our trading approach simple—focused on the only true leading indicator: price. Our goal is to help you build a clear, rule-based trading plan grounded in clean price action. Subscribers Receive:

2
1
7
𝐆𝐨𝐥𝐝𝐞𝐧👁️ - 𝐀𝐜𝐜𝐮𝐦𝐮𝐥𝐚𝐭𝐢𝐨𝐧 𝐚𝐧𝐝 𝐃𝐢𝐬𝐭𝐫𝐢𝐛𝐮𝐭𝐢𝐨𝐧 𝐋𝐢𝐧𝐞 𝐈𝐧𝐝𝐢𝐜𝐚𝐭𝐨𝐫 𝐄𝐱𝐩𝐥𝐚𝐢𝐧𝐞𝐝. The Accumulation/Distribution Line indicator is a volume-based technical indicator that measures the flow of money into or out of a stock or asset. It helps

0
0
1
$SLI. $SLI has reached its measured move target at the 127% Fibonacci extension following the breakout from its ascending triangle, a classic area where momentum often stalls. Price has been consolidating at this level, suggesting a potential pause in the trend. Yesterday’s


$SLI. $SLI has delivered an exceptional move since the breakout we highlighted at the end of June in the post below, rallying over 40% within just 10 trading sessions. The breakout from the ascending triangle was clean, and momentum has remained strong, with no technical reason


0
0
4
$WTI. $WTI bulls are actively defending support at the lower boundary of its ascending broadening wedge, with the last two sessions printing spinning top candles—each showing higher lows and highs but lacking conviction. These spinning tops reflect hesitation, as both the upper


0
1
3
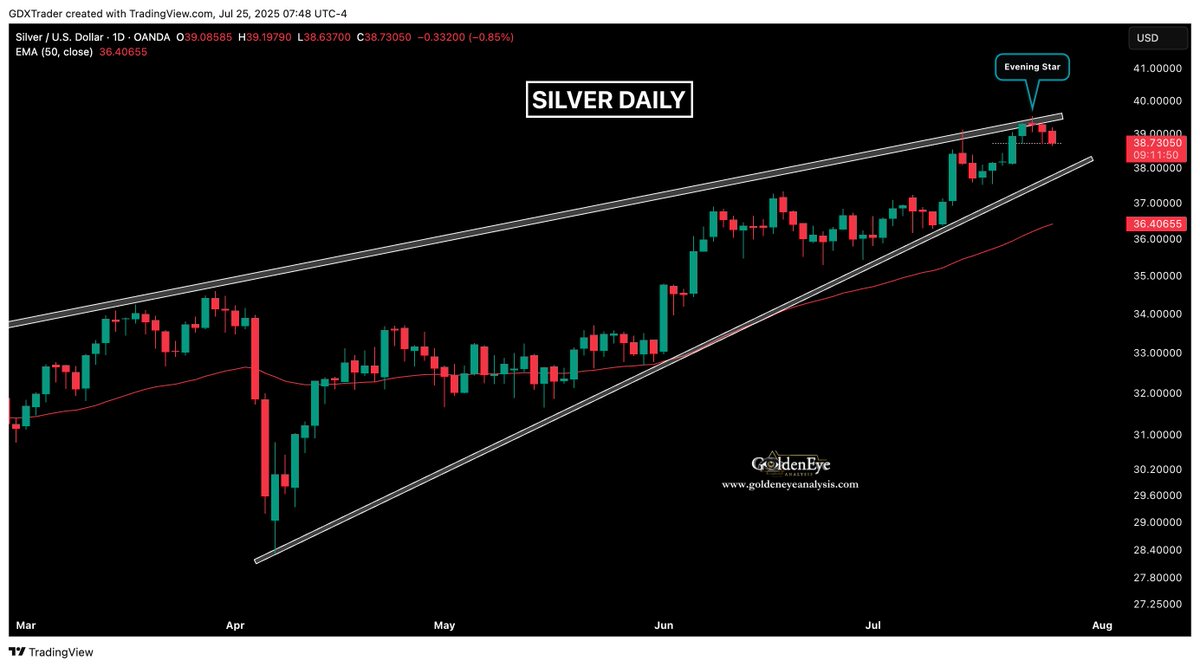
#SILVER . Silver completed an evening star pattern yesterday right at the resistance line of its rising wedge—typically a bearish reversal setup signaling a shift in momentum. This three-candle formation reflects exhaustion from buyers after an extended move, with indecision in


2
1
6
$DXY. $DXY printed a bullish engulfing candle yesterday right at descending support—a key level that also served as prior resistance, now acting as a backtest zone after the recent pullback. Bulls stepped in decisively, reclaiming the prior day's losses and closing near the


0
0
3
#BITCOIN. Following Wednesday’s dark cloud cover, price has continued to show weakness with back-to-back bearish continuation candles, each printing lower highs, lower lows, and lower closes—clear signs of short-term bearish control. However, in today’s session, bulls stepped


0
0
3
#PALLADIUM. On July 18, Palladium gave us a clear technical warning with a shooting star followed by a bearish engulfing candle, both forming near the upper boundary of its rising wedge—signaling a likely short-term top. This was further confirmed by bearish RSI divergence,


0
0
2
RT @GDXTrader: 𝐆𝐨𝐥𝐝𝐞𝐧👁️ - 𝐏𝐫𝐢𝐜𝐞 𝐏𝐚𝐲𝐬 - 𝐋𝐞𝐚𝐫𝐧 𝐓𝐨 𝐅𝐨𝐥𝐥𝐨𝐰 𝐈𝐭. We keep our trading approach simple—focused on the only true leading indicator:….
0
2
0
#COFFEE. Coffee is attempting to challenge the upper boundary of its descending channel, hinting at a potential shift in momentum. A confirmed breakout above this channel would be the first step, but bulls still face significant overhead resistance near the 50-day and 200-day

0
0
2
#PLATINUM. Following our July 23 post below highlighting the inside range candle at resistance of platinum’s rising wedge, we’ve now seen confirmation of that indecision breaking to the downside—marking the first true pivot reversal since late May. The pattern breakdown below


#PLATINUM . Yesterday we noted that Platinum was printing an inside range candle right at the resistance line of its rising wedge, a classic sign of consolidation beneath pressure. Today, that indecision resolves to the downside with a bearish continuation candle, closing below


0
0
4
$NEM. We've been tracking a potential inverse head and shoulder pattern in $NEM since November 2024 👇—a classic bottoming formation that signals a potential trend reversal if confirmed. The left shoulder, head, and right shoulder have taken shape with a well-defined neckline


$NEM . $NEM has presented a Fred Tam candle for the week, characterized by a gap within last week’s range and a close above its opening price. This candle serves as an early signal of a potential shift in momentum, suggesting that the bears, who have dominated for the past four


0
0
3
#NATGAS . Natural gas printed an inside range candle today, consolidating within the body of yesterday’s bullish harami. During our post-market educational review for subscribers, we noted that for this harami to serve as a valid pivot low reversal following the recent


0
0
9
#COPPER . Copper printed a shooting star candle yesterday right at all-time highs, signaling a potential exhaustion of bullish momentum. The session opened strong, extending the breakout from last week’s bullish pennant, but bulls couldn’t hold the gains—price reversed intraday


0
0
4
#PLATINUM. Following our July 23 post below highlighting the inside range candle at resistance of platinum’s rising wedge, we’ve now seen confirmation of that indecision breaking to the downside—marking the first true pivot reversal since late May. The pattern breakdown below
#PLATINUM . Yesterday we noted that Platinum was printing an inside range candle right at the resistance line of its rising wedge, a classic sign of consolidation beneath pressure. Today, that indecision resolves to the downside with a bearish continuation candle, closing below
0
0
2
#GOLD . Gold continues to show weakness following the bearish engulfing candle on July 23rd, which printed right at overhead horizontal resistance of its ascending triangle—a level that has now rejected price four separate times. The rejection wasn’t subtle either. Wednesday


#GOLD . Gold prints a bearish engulfing candle today right at the horizontal resistance of its ascending triangle—a clear sign of selling pressure as bears step in to reject higher prices. The range continues to tighten as we approach the apex of the triangle, signaling that a


1
0
3
#COOCA. Cocoa prints a bullish inside range candle today, signaling that bulls are stepping in to defend the newly reclaimed support—formerly the resistance of the prior descending channel and horizontal support. Price action is consolidating in a tight range above horizontal

0
0
2
$DXY . $DXY prints a bullish engulfing candle today, signaling a potential pivot reversal off prior resistance now acting as support. This type of price action reflects buyer interest stepping in after a brief pullback, reclaiming control from the bears. The engulfing candle


1
0
8
𝐆𝐨𝐥𝐝𝐞𝐧👁️ - 𝐃𝐢𝐟𝐟𝐞𝐫𝐞𝐧𝐭 𝐎𝐫𝐝𝐞𝐫 𝐁𝐥𝐨𝐜𝐤𝐬. Explained + How to Trade Them:. 1.Evening Star Order Block. 🔹3-candle pattern (bull, indecision, bear).🔹Signals strong reversal at supply.✅ Enter on retest of the order block.🎯 SL: above OB zone | TP: prior lows

1
0
4
#GOLD. Gold printed a bearish engulfing candle yesterday right at the resistance of its ascending triangle, marking the fourth rejection at this level—highlighting a clear supply zone where sellers consistently step in. Similar to the bearish engulfing seen back in June,

1
0
9
#BITCOIN. Bitcoin continues to consolidate within a rectangle high base pattern. Yesterday’s dark cloud cover at resistance hinted at potential short-term weakness, but today’s session failed to close below the low of that candle, signaling that bears lack follow-through.


1
1
6