FusionCharts
@FusionCharts
Followers
3K
Following
336
Media
740
Statuses
3K
FusionCharts offers delightful JavaScript charts. Follow us to learn about awesomeness of #JavaScript.
Joined December 2008
FusionCharts + Flexbox = Seamless, resizable charts. Here’s how to implement it right .➡️ . #DevTips #FrontendDev #DataViz
0
0
0
AI-powered charting for JavaScript is here!.Get automatic chart suggestions, smart labels & more with @FusionCharts. 🚀 Read: #DataVisualization #AIForDev #JSCharts #FusionCharts #DevTools
0
0
0
Struggling with docs?.FusionCharts' new AI-powered documentation helps you get answers instantly. Explore now 👉 #DataViz #AItools #FusionChart
1
0
0
Master stock charts & make sense of market trends! Read more 👉 #DataVisualization#StockCharts#FinancialData#StockMarketInsights#ChartingSolutions#TradingCharts
0
4
9
Bubble maps = Insightful geographic storytelling!. Learn how to leverage them👉 . #BubbleChart#BusinessIntelligence#BusinessIntelligence#ChartsAndGraphs
0
0
5
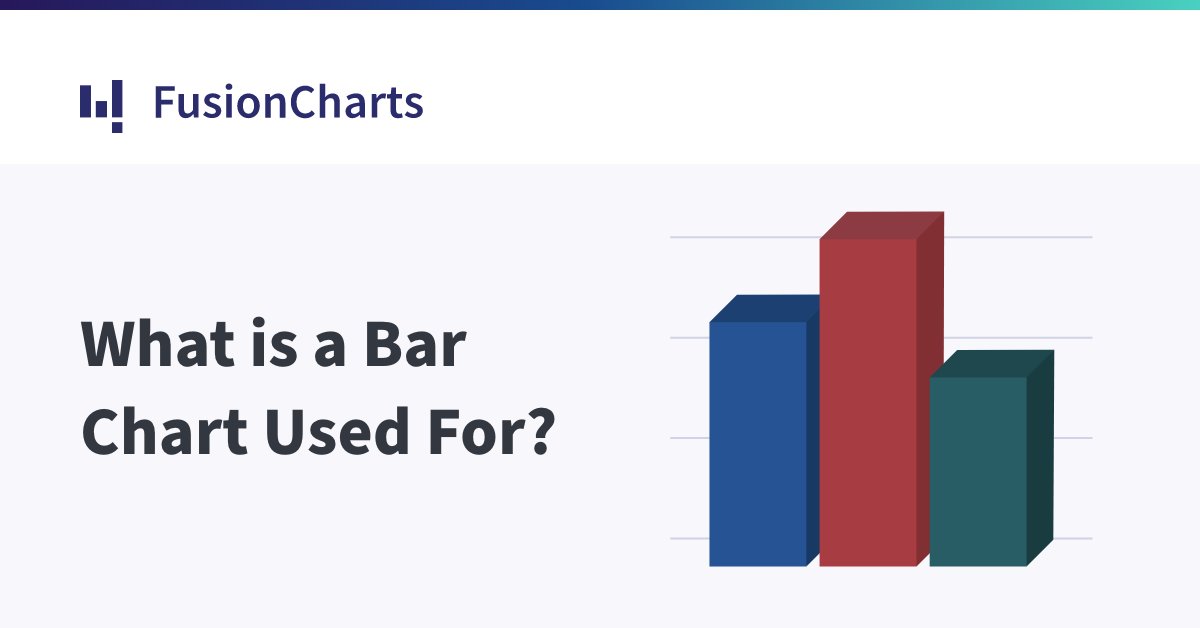
Bar charts: The foundation of great visual storytelling. Are you using them right? .Read more 👉 #DataVisualization #Charts #Graphs #BarChart #DataStorytelling #InfoGraphics
0
1
8
Confused about which chart to use? .📊 Get this step-by-step guide on choosing and using charts effectively. 🔗 Read here: #DataVisualization #Charts #Analytics
0
1
1
Not all charts are created equal! 📊 Pick the right visualization for your data science project with this helpful guide. 🔗 Read here: Read now: #FusionCharts #AnalyticsTools #BusinessIntelligence #DataInsights #DataVisualization
0
2
11
Building a great dashboard? .📊 Follow this step-by-step guide to create visualizations that drive action & insights. 🚀. 🔗 Read here: Read now: #DataVisualization #BusinessDashboards #Fusioncharts #TechTips #DataAnalytics
0
4
7
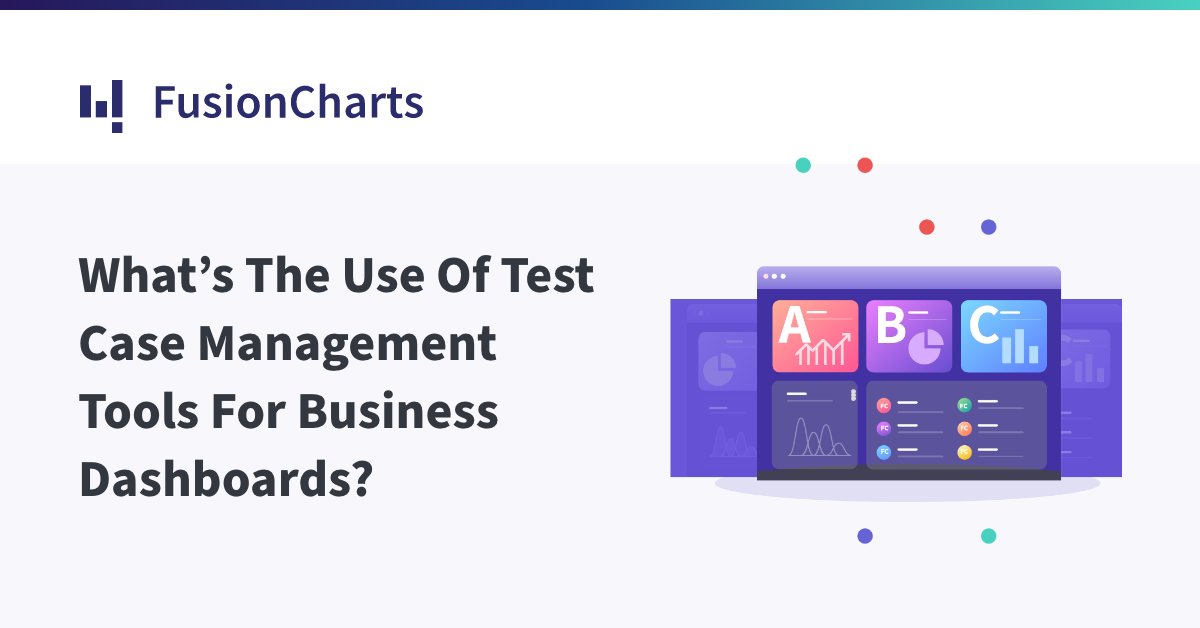
Dashboards only work if the data is reliable. 📊 Use test case management tools to ensure accuracy, efficiency, and error-free visualizations. 🔗 Learn more: Read now: #TestCaseManagement #BusinessDashboards #DashboardTesting #DataVisualization
0
2
3
Dashboards that work! 🖥️. 📊 Follow these 10 golden rules for clear, effective, and engaging dashboards! 🚀 #UX #DataViz.🔗 #DataVisualization #BusinessIntelligence #FusionCharts #UXDesign #InfoDashboard
0
1
8
Love data as much as we do? ❤️📊 Check out how you can make your charts sing this #ValentinesDay! 🎶💘 #DataViz #Charts. 🔗
0
0
0
Bar, line, & area charts combined? Yes, please! 🙌 Create impactful insights with Combination Charts from FusionCharts. 🌟.👉 #DataViz #FusionCharts #ChartsThatMatter
1
0
1
Bar, line, & area charts combined? Yes, please! 🙌 Create impactful insights with Combination Charts from FusionCharts. 🌟.👉 #DataViz #FusionCharts #ChartsThatMatter
0
0
0
📊 Simplify your data! FusionCharts’ stacked charts make complex datasets visually intuitive. Start visualizing today! 🚀.👉 #DataVisualization #FusionCharts #StackedCharts
0
0
0
Bring your data to life with our Pie & Doughnut Charts! 🍩📊.✨ Easy to integrate.✨ Fully responsive.✨ Perfect for clear insights.👉 Explore Now: #DataVisualization #PieCharts #DoughnutCharts #FusionCharts
0
0
0
📊 Elevate your data stories with FusionCharts' Line & Area Charts!. ✔️ Customizable.✔️ Sleek designs.✔️ Perfect for trend analysis. Explore now:👉 #DataViz #LineCharts #AreaCharts #FusionCharts #Analytics
0
0
1
Data visualization made smarter for finance pros!.Learn the art of stock charting with this expert guide from FusionCharts. 🏦👉 . #StockCharts #FinanceTech #FinancialData #InvestmentAnalysis #FusionCharts
3
16
32


