
DebugBear
@DebugBear
Followers
2K
Following
528
Media
546
Statuses
1K
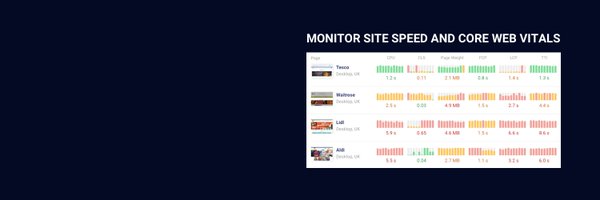
Monitor page speed and Core Web Vitals in the lab and with real user data.
London, England
Joined July 2018
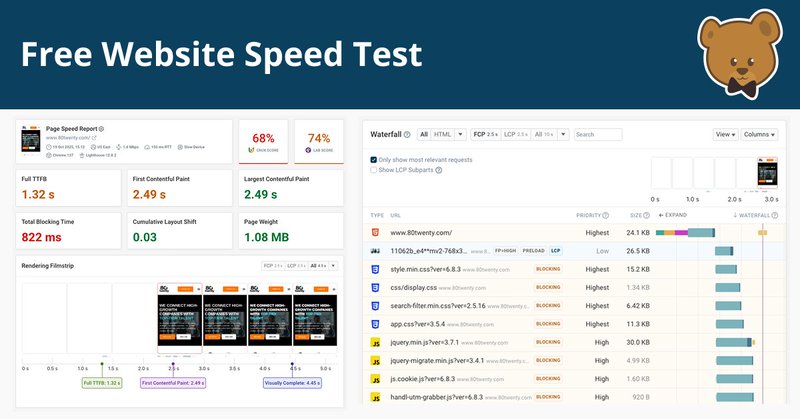
We've built a FREE site speed testing tool. Check if your website meets Google's Core Web Vitals and see what you can do to make it load faster. Test your website here 🚀 https://t.co/B1gGSRXhQy
debugbear.com
Measure the speed and Core Web Vitals of your website. Find out how to make your website load faster and rank well in Google.
7
50
171
Lazy loading out-of-viewport images can make the main content on your website load faster. ⬇️ Learn how in this video. https://t.co/KqjaZEwsLu
1
1
5
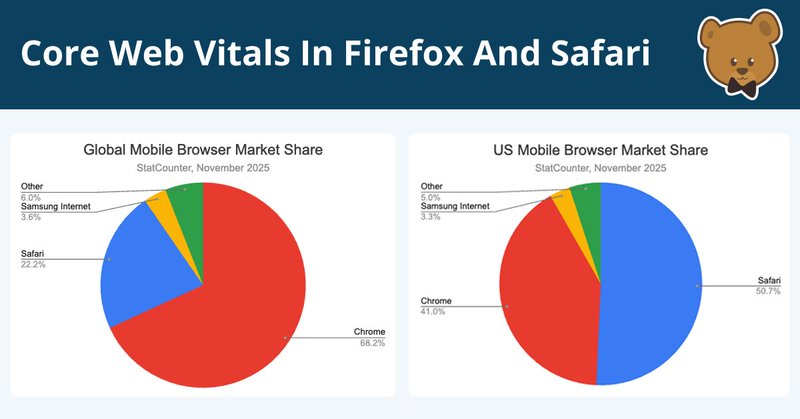
You can now measure LCP and INP scores in both Safari and Firefox! https://t.co/xhZ8G6UJqT
debugbear.com
Firefox and Safari now support LCP and INP Core Web Vitals metrics, providing new insight into real visitor experience.
0
3
9
Slow interactions aren't always caused by specific UI elements, but can also be caused by global tracking scripts. Our new article discusses this and other findings on a real world website: https://t.co/xPcHIhhfai
0
1
1
We published a new video on the network throttling feature in Chrome DevTools. It might not work the way you'd expect! 😮 https://t.co/1VImz1nqNp
0
0
3
Configuring browser caching correctly results in much faster page load times for repeat visits. Our article on the cache-control HTTP header explains how to set it up: https://t.co/aWISn1KmQ4
0
0
0
🎥 New video: learn how to use real user monitoring data to debug Interaction to Next Paint scores! https://t.co/vloIWB8Wq0
0
0
2
Did you know that Firefox now supports the Interaction to Next Paint metric? And that Safari is working on adding support? Learn about this and other developments in our year-in-review post for 2025!

debugbear.com
Find out how web performance changed in 2025, and what changes are coming up in the future.
0
0
4

Added a new request stats view to the DebugBear page speed test result! Try it for free here https://t.co/AtjuqjGrPG
0
2
3
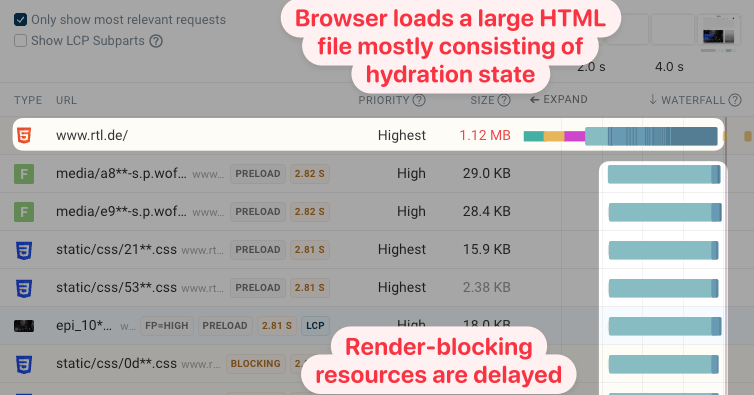
What's causing large HTML download size? It's often images, fonts, and data embedded within the code! https://t.co/POE9jD7YOr
calendar.perfplanet.com
Most HTML documents are relatively small, providing a starting point for other resources on the page to load. But why do some websites load several megabytes of HTML code? Usually it's not that...
0
1
1
New video: learn how to debug slow page load time and investigate regressions using real user data. https://t.co/ffzk64qssJ
0
0
1
Product updates for November: 💰 Measure conversion rates in RUM 📕 Improved HTML Size Analyzer 🐌 Track synthetic INP scores ✅ Free website SEO checker https://t.co/MoCiEPU4fT

debugbear.com
We've been working on making it easier to measure the business impact of performance, and analyze your synthetic test results.
0
0
0
Did you accidentally include large images in your JSON code? Our JSON size analyzer highlights any embedded images in addition to providing a property-based size breakdown. https://t.co/ggB4Fl54O6
0
0
1
What's causing the Calendly booking page to load slowly sometimes? We've investigate in our latest blog post: https://t.co/pZFZeuvol7
0
0
1
Want to get the most out of DebugBear synthetic testing? This recent presentation at the PerformanceObserver meetup explains how to interpret the DebugBear test results and waterfall view. https://t.co/VToIDunrVc
0
0
0
How can real user data help you debug content shifts experienced by your visitors? Our new video explains how to debug poor CLS scores step by step using RUM data. https://t.co/A4uh07CHS1
0
0
1

✨ SPDY STREAM 018 ✨ TODAY, we have @mattzeunert from @DebugBear! He recently penned an piece for @smashingmag about the importance of metric monitoring + effectively collecting #CoreWebVitals. We're chatting live later today 📆 TODAY! ⏰ 1pm EST, 7pm CET 🔗
0
2
5
Our free HTML size analyzer can tell you what's taking up space in your HTML! Identify embedded images, fonts, or JavaScript hydration state. https://t.co/nPpNHYNz6D
0
1
6
Small improvement to our request waterfall: view the request count and page weight for your selected requests. For example, you can quickly see how many CSS files your website is loading, or how much data transfer is due to PNG files. Learn more about our request waterfall
0
0
2

There are lots of tips for improving your website performance. But even if you follow all of the advice, are you able to maintain an optimized site? And are you targeting the right pages? ↬ Matt Zeunert outlines an effective strategy for web performance optimization and
1
1
11
You can now measure INP scores as part of DebugBear user flows and track how your scores change over time.
0
0
2