
Abdur-Rasheed Adeoye
@DAAXRasheed
Followers
2K
Following
3K
Media
249
Statuses
1K
Microsoft, Google and IBM Certified Data/BI Analyst •Fabric Analytics Engineer • Bioinformatics • Data Viz Specialist •Infographics Designer •Leather Advocate
Lagos
Joined December 2013
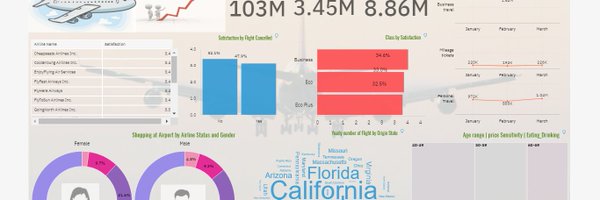
My latest #Datavisualization wizardry using @msexcel For other Data Story telling visuals 😍 👇🏾 https://t.co/f9b1AUR9qA
#DataAnalytics #DataScience #AI #excel
20
34
165
Great opportunities for Accountants by yours truly Papilo of London 🇬🇧

Technical Accounting Mentorship I have thought about how I can make more impact with my knowledge and experience around technical accounting outside of social media posts. On that note, I have decided to start a technical accounting mentorship. The first phase (a trial run)
0
0
2
🎮 Puzzle 002 for data minds Think you cracked it? 🧩 Drop your answers in comment 👇😃 Hint: These tools are the backbone of dashboards and storytelling in data analytics. DataPuzzle #AnalyticsChallenge #PowerBI #Tableau
🎮 Puzzle 002 for data minds 🧠 1️⃣ Full of numbers, not a calculator. Tells stories, never speaks. Changes shape with every viewer. 2️⃣ Used to slice, not a knife. Filters data, not a sieve. Sits quietly on your report, waiting for interaction Drop your answers below 👇😃
0
0
1
🎮 Puzzle 002 for data minds 🧠 1️⃣ Full of numbers, not a calculator. Tells stories, never speaks. Changes shape with every viewer. 2️⃣ Used to slice, not a knife. Filters data, not a sieve. Sits quietly on your report, waiting for interaction Drop your answers below 👇😃
1
1
2
Most preferred answers based on the tools used to perform those tasks 1️⃣ Database / Dataset 2️⃣ Data Pipeline / Pivot Table / DAX 3️⃣ Power Query Remember @DataFestAfrica holds on 10/18/2025 at Anchor Event Place, Ikeja, Lagos! Connect and network 😃
🎮 Data Analyst Puzzle Time! Drop your answers in comments 👇 1️⃣ I’m packed with rows, never sleep, and guard secrets silently 2️⃣ I power dashboards behind the scenes, no credit, just crunch 3️⃣ I clean typos, blanks & duplicates… no mop required Let’s see what youve got💡
0
0
3
Greetings at dawn Data buddies 😃 Let's see who got the analytics brain 🧠 with these 3 questions. Drop your answers in comments 👇
🎮 Data Analyst Puzzle Time! Drop your answers in comments 👇 1️⃣ I’m packed with rows, never sleep, and guard secrets silently 2️⃣ I power dashboards behind the scenes, no credit, just crunch 3️⃣ I clean typos, blanks & duplicates… no mop required Let’s see what youve got💡
1
0
1
Greetings at dawn Data buddies 😃 Let's see who got the analytics brain 🧠 with these 3 questions. Drop your answers in comments 👇
🎮 Data Analyst Puzzle Time! Drop your answers in comments 👇 1️⃣ I’m packed with rows, never sleep, and guard secrets silently 2️⃣ I power dashboards behind the scenes, no credit, just crunch 3️⃣ I clean typos, blanks & duplicates… no mop required Let’s see what youve got💡
0
0
2
🎮 Data Analyst Puzzle Time! Drop your answers in comments 👇 1️⃣ I’m packed with rows, never sleep, and guard secrets silently 2️⃣ I power dashboards behind the scenes, no credit, just crunch 3️⃣ I clean typos, blanks & duplicates… no mop required Let’s see what youve got💡
8
0
5
You've got to try #Grouping and #Binning in @PowerBI — it's the easiest way to break down complex data into digestible chunks. Perfect for any Power BI project. Check out the quoted tweet with real life examples and @YouTube resources #DataMadeEasy #PowerBIHacks
🚀 #Midweek @PowerBI hack Make your report easier to read when you've multiple categories with #Grouping + #Binning Grouping clusters categorical variables (Product, Regions) Binning slices continuous data (Age or revenue) Open 🧵 for more resources & examples #DataMadeEasy
0
0
2
@PragmaticWorks
https://t.co/xelnrPFwud
@AhmedOyelowo
https://t.co/Zk98DmURTg You're always welcome See you tomorrow for more #Analytics hacks #DataViz #AnalyticsLife
0
0
2
❤️ Like & 🔁 Retweet to help others Follow @DAAXRasheed for more Power BI wisdom hacks to make you a pro 💎 And remember @DataFestAfrica holds on 18th Oct. 2025 at Anchor Event Place, Ikeja, Lagos! It's the biggest community of data and AI professionals in Africa.
1
0
1
- Grouping helps you put similar things together. Like putting all "Apple", "Samsung", and "Tecno" phones into one group called "Phones". - Binning breaks numbers into ranges. Like turning ages into "18–25", "26–35", etc. #SimpleTips #DataMadeEasy #DataViz #AnalyticsLife
1
0
1
🚀 #Midweek @PowerBI hack Make your report easier to read when you've multiple categories with #Grouping + #Binning Grouping clusters categorical variables (Product, Regions) Binning slices continuous data (Age or revenue) Open 🧵 for more resources & examples #DataMadeEasy
1
1
5
“If you use Power BI but still feel like your dashboards are just...meh—this thread is for you. Here are practical tips that’ll turn your reports from basic to brilliant. No fluff. Just real tricks that works. 🧵👇” Enjoy and you're welcome. #DataFestAfrica2025
#MondayMorning 5 exquisite @MSPowerBI Practical Tips for Everyday Users 1. Use Slicers Like a Pro 🎯 Don’t just drop slicers randomly—use sync slicers across pages to maintain uniformity where necessary. It’s cleaner, smarter, and keeps your users focused. #AnalyselkeaPro
0
0
3
“If you use Power BI but still feel like your dashboards are just...meh—this thread is for you. Here are practical tips that’ll turn your reports from basic to brilliant. No fluff. Just real tricks that works. 🧵👇” Enjoy and you're welcome. #DataFestAfrica2025
#MondayMorning 5 exquisite @MSPowerBI Practical Tips for Everyday Users 1. Use Slicers Like a Pro 🎯 Don’t just drop slicers randomly—use sync slicers across pages to maintain uniformity where necessary. It’s cleaner, smarter, and keeps your users focused. #AnalyselkeaPro
0
0
2
“If you use Power BI but still feel like your dashboards are just...meh—this thread is for you. Here are practical tips that’ll turn your reports from basic to brilliant. No fluff. Just real tricks that works. 🧵👇” Enjoy and you're welcome. #DataFestAfrica2025
#MondayMorning 5 exquisite @MSPowerBI Practical Tips for Everyday Users 1. Use Slicers Like a Pro 🎯 Don’t just drop slicers randomly—use sync slicers across pages to maintain uniformity where necessary. It’s cleaner, smarter, and keeps your users focused. #AnalyselkeaPro
0
0
3
4. Tooltips: Create report page tooltips to show extra insights without cluttering your main visuals. It’s like giving your report a secret layer. 5. Use Page Navigation Buttons with actions to navigate between pages. It feels like a real app & improves user experience. Ciao
0
1
3
If this thread helped you build better models, ❤️ Like & 🔁 Retweet to help others Follow @DAAXRasheed for daily Power BI wisdom, DAX tips, and dashboard design gems 💎 And remember @DataFestAfrica is around the corner 👍, the largest platform for data gems in Africa
1
0
2
2. Conditional Formatting = Instant Clarity Instead of coloring by value, try formatting by rules/field values. It turns boring tables into decision-making tools. 3. Group Your Measures with display folders to organize measures. Your future self (and your team) will thank you.
1
1
2
#MondayMorning 5 exquisite @MSPowerBI Practical Tips for Everyday Users 1. Use Slicers Like a Pro 🎯 Don’t just drop slicers randomly—use sync slicers across pages to maintain uniformity where necessary. It’s cleaner, smarter, and keeps your users focused. #AnalyselkeaPro
1
4
14
A well documented report by one of my students at @hautinstitute BTW this is her first documented report and it's supercalifragilisticexpialidocious 👌 👏 already https://t.co/f9QnQlBIbm Be like @BiolaLigali Remember @DataFestAfrica is around the corner 👍
0
3
8