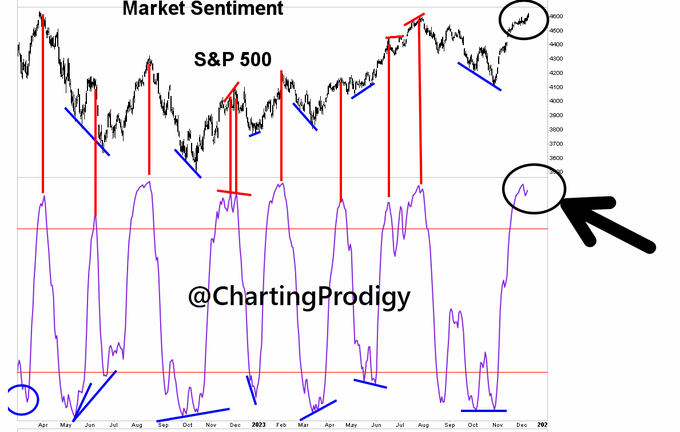
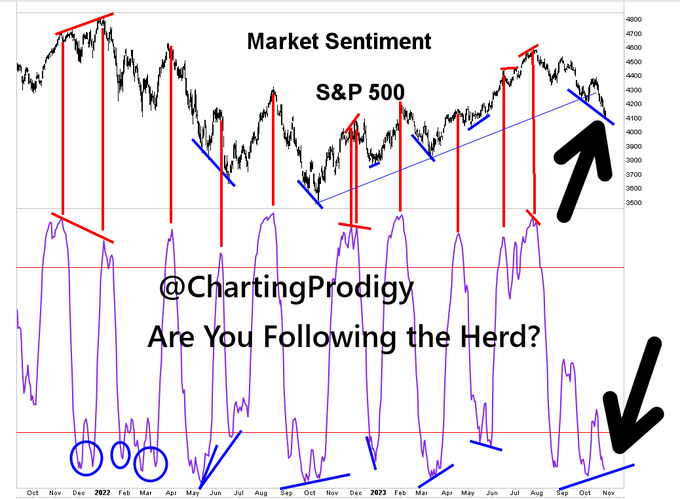
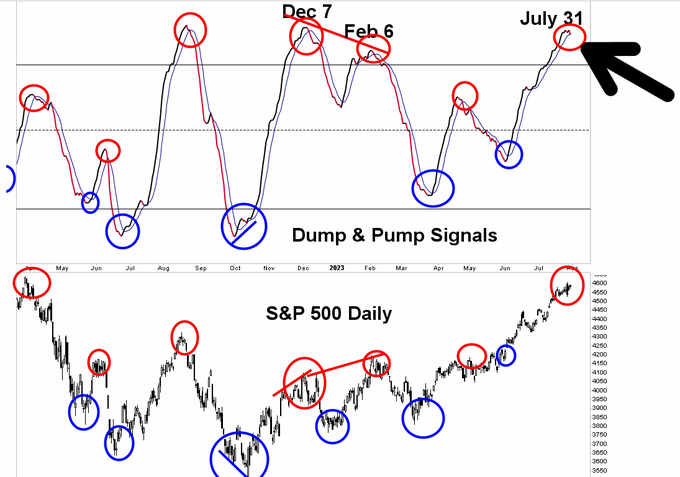
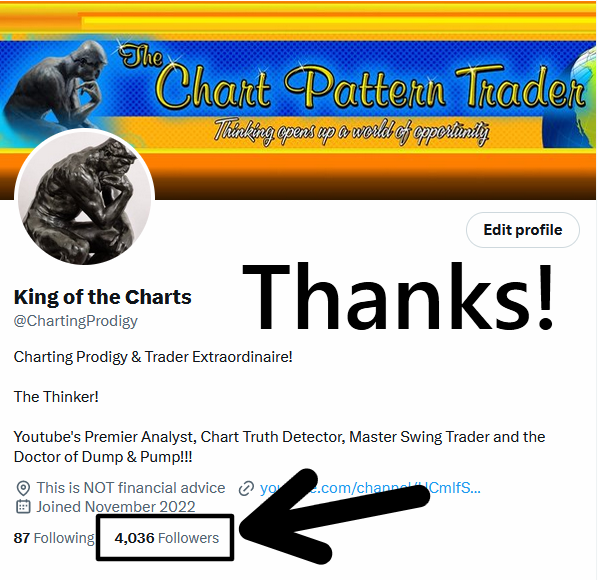
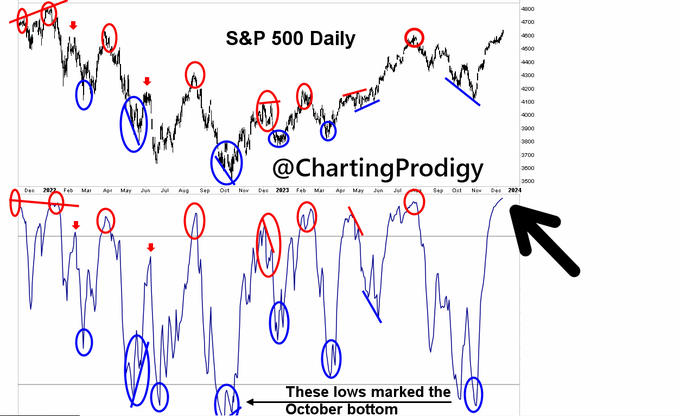
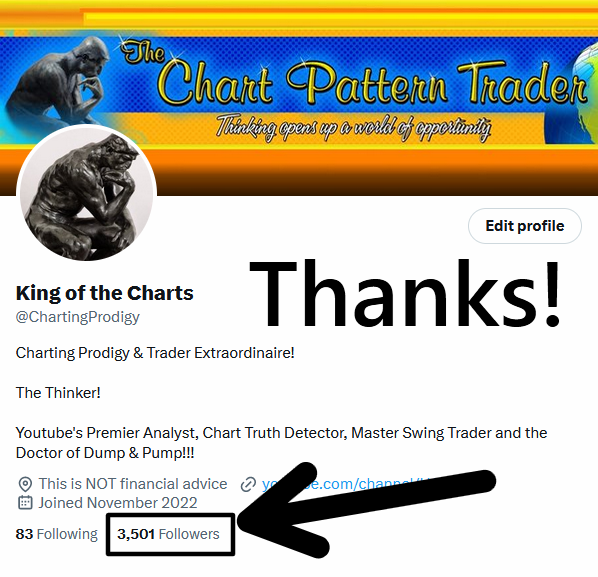
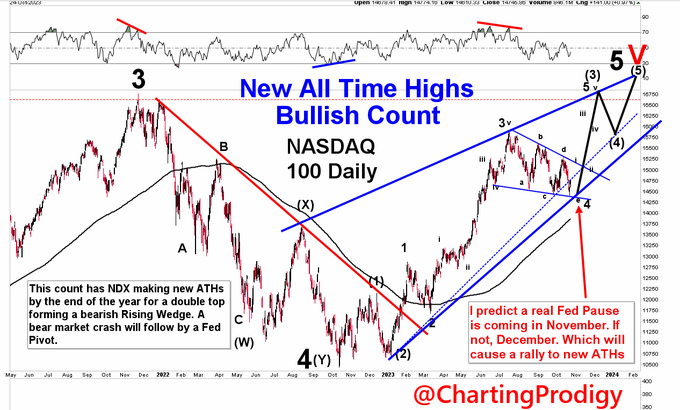
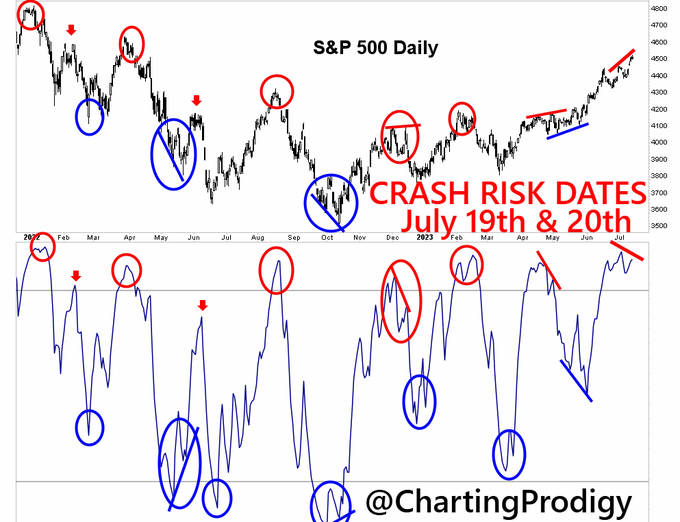
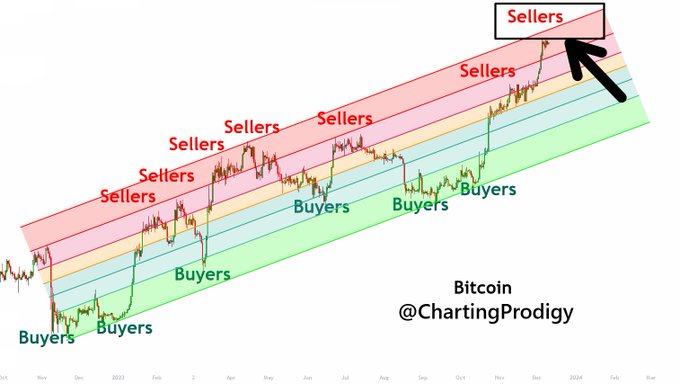
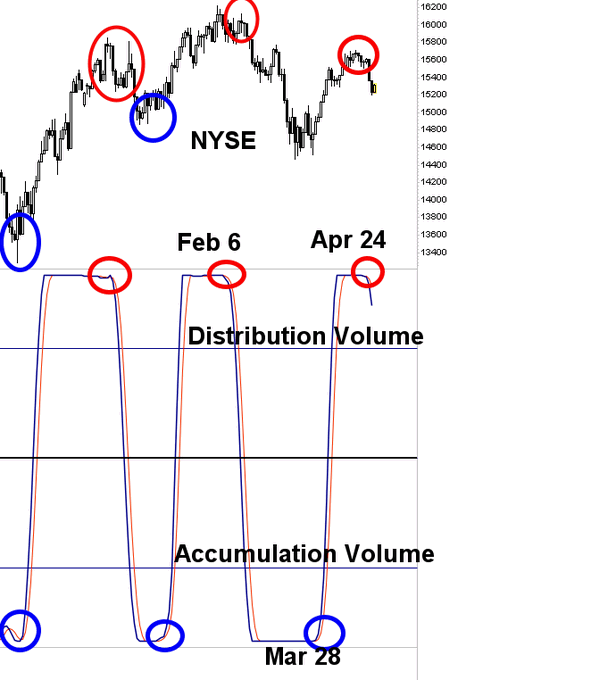
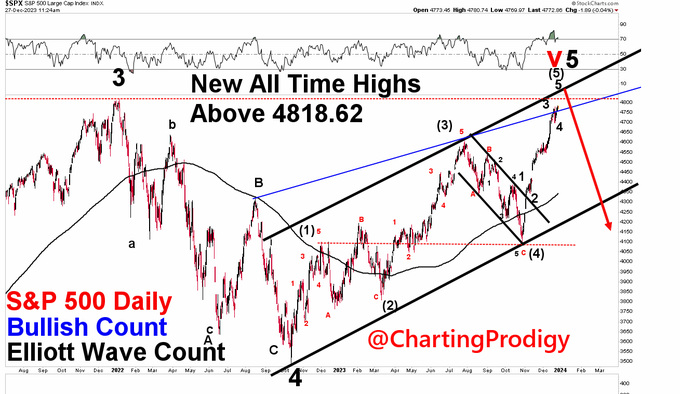
King of the Charts Profile Banner
King of the Charts Profile
King of the Charts

@ChartingProdigy

Followers
13,261
Following
278
Media
1,837
Statuses
2,221

Charting Prodigy & Trader Extraordinaire! The Thinker! Youtube's Premier Analyst, Chart Truth Detector, Master Swing Trader and the Doctor of Dump & Pump!!!

This is NOT financial advice
Joined November 2022
Don't wanna be here? Send us removal request.
Explore trending content on Musk Viewer
Pinned Tweet
@ChartingProdigy
King of the Charts
1 year
Tweet media one
0
13
201
@ChartingProdigy
King of the Charts
5 months
CRASH Coming My Risk-Reward Model for #SP500 has reached extremes. Rollover likely this week after 5 up weeks Tops form by either reaching an extreme or rolling over at an extreme. The last 2 crosses allowed me to call the days of both the July top & Oct bottom . $SPX $SPY $QQQ
Tweet media one
0
86
425
@ChartingProdigy
King of the Charts
6 months
. Stock Market CRASH Over Bottom Here Here's My #SP500 #Elliottwave Count. Not To Be Confused With Imitations $SPY Finished an ABC Correction Friday or Will Monday. Fed Pause & Rally Into The End of the Year to New ATHs, Then a Top & Bear Market CRASH on a Fed Pivot $SPX $QQQ
Tweet media one
0
65
394
@ChartingProdigy
King of the Charts
1 year
$SPX $QQQ $VIX Banking Crisis Coming When investors are risk-on, money flows into riskier investments like stocks. When investors are risk-off, money flows into less-risky assets We are currently at levels where tops in the market form (arrow) & move into a risk-off environment
Tweet media one
0
80
333
@ChartingProdigy
King of the Charts
5 months
. I've correctly called the day of the July top & the day of the Oct bottom for #SP500 My #Elliottwave count, not to be confused with imitations, assumes $SPY will pullback, then a year end rally to new ATHs forming in Q1 2024. Followed by a rug pull & CRASH . $SPX $QQQ $AAPL
Tweet media one
0
43
303
@ChartingProdigy
King of the Charts
10 months
$SPY $QQQ $SPXS $VIX High Probability the CRASH Starts Next Week #SP500 & #NASDAQ CRASH Could Start On or By July 19 or July 20 Triple negative divergences on S&P 500 IF IF IF a reversal starts Monday $SPX could BEGIN a CRASH move by Wednesday July 19 or Thursday July 20
Tweet media one
0
46
275
@ChartingProdigy
King of the Charts
4 months
While I called the day of the July top, the day of the Oct bottom & predicted this rally. I will flip back to bearish soon because a major top is forming. The Herd is confident the rally will continue. Dumb Money is forming negative divergence like @ the July top . $SPX $SPY $QQQ
Tweet media one
0
45
256
@ChartingProdigy
King of the Charts
5 months
. When Called the Day of the July Top I Got Free Hate From The Bulls Then When I Called The Day of the October Bottom The Bears Attacked Me I'm Ready For More Hate From the Bulls I'm Not Interested In The Bullish Side or the Bearish Side, Only the Right Side . $SPX $SPY $QQQ
Tweet media one
0
35
248
@ChartingProdigy
King of the Charts
9 months
Quadruple negative divergence on S&P 500 The strongest reversal signal in technical analysis. .
Tweet media one
0
58
228
@ChartingProdigy
King of the Charts
5 months
. Powell speaks twice today. The first time to wreck the bears, the second time to wreck the bulls. The #SP500 is pushing slightly higher, the #NASDAQ100 is not. They are diverging from one another. This has marked tops & bottoms throughout 2023 . $SPX $SPY $QQQ #Powell #FOMC
Tweet media one
0
42
220
@ChartingProdigy
King of the Charts
1 year
$SPY $SPXS $QQQ $SQQQ $ES $AAPL $VIX $SPX My Power Swings Indicator rolled over on Monday suggesting that I should be looking for a top on #SP500 . Tops are marked when the indicator reaches extremes or rolls over. Sometimes it rolls over & price goes a little higher, then turns
Tweet media one
0
30
220
@ChartingProdigy
King of the Charts
1 year
$QQQ VIX Crash Signal Triggered Every time VIX tagged its 2017 trendline a crash followed. Sometimes $SPX moved a bit higher, then crashed The last time $VIX tested it was on Feb 2, that day #SP500 peaked with the Feb top Stock Market CRASH Video .
Tweet media one
0
35
211
@ChartingProdigy
King of the Charts
1 year
$SPY $SQQQ $QQQ $SPX #SP500 $NQ $ES $NDX CRASH Coming Not only is #NASDAQ 100 weekly chart getting a 9 Count Sell Signal. It has also formed or recently formed on the stocks leading the rally $AAPL, $MSFT, $AMZN & $META. The all have 9 Count Sell Signals on their weekly charts
Tweet media one
0
42
207
@ChartingProdigy
King of the Charts
4 months
. MY SIGNALS ARE STILL BULLISH, but I think the stock market may try to peak next week, maybe on January 3 or 4. My analysis is subject to change based on data. But I called the day of the July top & day of Oct bottom correctly for $NDX & $SPX. Will I be right again? . $SPY $QQQ
Tweet media one
0
31
206
@ChartingProdigy
King of the Charts
5 months
. I've correctly called the day of the July top & the day of the Oct bottom for #NASDAQ100 My #Elliottwave count, not to be confused with imitations, assumes $NDX will pullback, then a year end rally to new ATHs forming a bearish Rising Wedge Followed by a CRASH . $SPX $QQQ $SPY
Tweet media one
0
24
194
@ChartingProdigy
King of the Charts
8 days
. SPY Here's another one of my trading system charts. It doesn't get much better than this folks. Please let me know that want me to keep posting my trading system charts by clicking on the❤️button. . $SPX $SPY $QQQ $NDX #Powell #PCE #GPD #trading #stockmarket #SwingTrading $AAPL
Tweet media one
0
5
198
@ChartingProdigy
King of the Charts
11 months
$SPX $QQQ $SPY #ratehikes Often There Is A Post Fed Selloff Within Days After A Hawkish Fed The Suppy-Demand Index is at extremes ahead of #Fed Chair #Powell 's 2-day Congressional Testimony next week. Higher levels than the extremes that formed the top during Nov 21 & Jan 22
Tweet media one
0
39
184
@ChartingProdigy
King of the Charts
6 months
. I Can't Believe How Few Are Following My Signals My Amazing Signals Allowed Me To Call the July top & the October Bottom Correctly I've correctly called the turns along the way Unlike most, I have the guts to tell you what I think right or wrong. My calls below $SPX $SPY $QQQ
Tweet media one
0
21
189
@ChartingProdigy
King of the Charts
6 months
. I've now correctly called the day of the July top & the day of the Oct bottom for S&P 500 My #Elliottwave count, not to be confused with imitations, assumes $SPX will pullback & then a year end rally to new ATHs My Oct bottom call in the link $SPY $QQQ
Tweet media one
@ChartingProdigy
King of the Charts
6 months
. Stock Market CRASH Over Bottom Here Here's My #SP500 #Elliottwave Count. Not To Be Confused With Imitations $SPY Finished an ABC Correction Friday or Will Monday. Fed Pause & Rally Into The End of the Year to New ATHs, Then a Top & Bear Market CRASH on a Fed Pivot $SPX $QQQ
Tweet media one
0
65
394
0
23
181
@ChartingProdigy
King of the Charts
9 months
$SPX $SPY $QQQ $AAPL CRASH STARTS JULY 3 As I said in my last tweet, I think we #SP500 move above today's intraday high at 4590 & close strong the last hr completing wave 2. Setting up for the start of the crash on Monday & Tuesday. Next week will start a long term crash move.
Tweet media one
0
29
180
@ChartingProdigy
King of the Charts
4 months
Every time the #DowJones passes through one of these blue Fib rings in the last 2 years it dumps, rolls down the path of the ring, bottoms & bounces off it, rising to the next ring. Then it repeats. Expect a dump as it just crossed through the ring again. . $SPX $SPY $QQQ $DJIA
Tweet media one
0
38
175
@ChartingProdigy
King of the Charts
7 months
. Here is my bullish Elliott Wave Count for the S&P 500. This count assumes $SPX will bottom around the 200 MA, it may have already (see alternative count). This counts suggests a massive rally into the end of the year for a double top. A Fed pause & earnings could do that. $SPY
Tweet media one
0
29
172
@ChartingProdigy
King of the Charts
5 months
. #Powell is going to be the Grinch that stole Christmas Market Sentiment is forming negative divergence at extremes. It is still a work in progress, but could finish with the #CPI data or the #FOMC on Wed. #Fed will push back on the idea of 125BP rate cuts in 2024 $SPX $SPY $QQQ
Tweet media one
0
36
164
@ChartingProdigy
King of the Charts
1 year
$QQQ Every time the VIX bounced off of its 2017 trendline or pullback towards it, a big selloff followed. Sometimes the $SPX moved a bit higher, then sold off The last time the $VIX tagged it was on Feb 2, that day #SP500 peaked with the Feb top VIX is about to tag it again! .
Tweet media one
0
31
163
@ChartingProdigy
King of the Charts
1 year
$SPX $QQQ It's a shame when haters, naysayers & trolls drive away a good analyst like @MauroBianchi24 . This kid had only been doing TA for 2 yrs & has real talent. It's sad that mean-spirited ppl viciously attacked Him so much that He quit posting. I think I'll join you Mauro!
Tweet media one
1
8
161
@ChartingProdigy
King of the Charts
5 months
. Since I Called the Day of the S&P 500 Bottom on Oct 27th, it has rallied 11 %. Power Swings show it overbought & at the levels when I called the day of the top on July 27th. My signals remain bullish, but that will soon change. Expect a pullback then new ATHs . $SPX $SPY $QQQ
Tweet media one
0
11
159
@ChartingProdigy
King of the Charts
6 months
. Don't Follow the Herd The Herd was bullish at the July top when I called the day of the top. The Herd said we would be at ATHs before summer ended & scoffed at a crash Now they say the market us going to crash after it crashed. The market is likely bottoming. $SPX $SPY $QQQ
Tweet media one
0
27
157
@ChartingProdigy
King of the Charts
9 months
$SPX $SPY $QQQ $NDX $VIX $AAPL $SPXS My Dump & Pump Signals for both the #SP500 & #NASDAQ100 got a bearish sell signals today. Again, I expect a selloff this week to confirm the topping tail candlestick on the NASDAQ 100's weekly chart. This will START a long term Super CRASH .
Tweet media one
0
17
157
@ChartingProdigy
King of the Charts
5 months
. Doing What I Was Meant To Do! Thank You To My First 9000 Twitter Followers Reached Today. Thank You For Your Interest In My Charts Success Ron Walker PhD The Doctor Of Dump & Pump . $SPY $NDX $SPXS $SQQQ $BTC #Bitcoin $QQQ $AAPL $SPX $BTC $SQQQ #SP500 $TQQQ $VIX $NVDA $ES_F
Tweet media one
34
3
148
@ChartingProdigy
King of the Charts
1 year
$SPXS $SPY The #SP500 has rallied back up near the Feb highs, but only 54 % of the stocks on $SPX are in uptrends (black arrow). If it doesn't reach extremes (red line) it could mark this a countertrend like the Feb & May tops. Major tops circled in red, minor tops in black .
Tweet media one
0
24
143
@ChartingProdigy
King of the Charts
1 year
$SPY $NDX $SPXS $SQQQ $BTC $SPXL $QQQ $AAPL $SPX #StockMarketcrash $SQQQ #SP500 $TQQQ $VIX Thank You To My First 3000 Twitter Followers Reached Yesterday. Thank You For Your Interest In My Work. Much Appreciated! Continued Success, Ron Walker PhD The Doctor Of Dump & Pump .
Tweet media one
0
4
143
@ChartingProdigy
King of the Charts
5 months
@fernandowavesfx Excellent work. But my guess is a melt up first to new ATHs, then a crash & bear market after Q1 2024. The market is going to selloff ahead of the Dec Fed meeting& likely get a higher low with a Fed pause. Then crash on Fed pivot in 2024. Outstanding work. You may be right!
19
3
147
@ChartingProdigy
King of the Charts
4 months
. Dumb Money Has Marked Tops & Bottoms My Dumb Money Indicator reached extremes, but hasn't formed negative divergence yet, which marked tops in 2022 & 2023. So I think $SPX will reach a new ATH & the upper end of my channel (link) then crash . $SPY $QQQ
Tweet media one
@ChartingProdigy
King of the Charts
4 months
. On Oct 28, I posted my #Elliottwave count (not to be confused with imitations), announcing my call for a $SPY bottom on Oct 27 & a rally to new all time highs by the end of the year (link). Compare the charts, it played out just as I predicted $SPX $QQQ
Tweet media one
0
20
125
0
22
142
@ChartingProdigy
King of the Charts
1 year
$SPY $NDX $SPXS $SQQQ $BTC $SPXL $QQQ $AAPL $SPX #StockMarketcrash $SQQQ #SP500 $TQQQ $VIX Thank You To My First 4000 Twitter Followers Recently Reached. Thank You For Your Interest In My Work. Much Appreciated! Continued Success, Ron Walker PhD The Doctor Of Dump & Pump .
Tweet media one
0
6
141
@ChartingProdigy
King of the Charts
5 months
. Stock Market Signaling A Top The #SP500 is Now Diverging With The #NASDAQ100 as It Has At Other Tops & Bottom URGENT Stock Market Crash Video Here . . . $SPX $SPY $NDX $QQQ $VIX #Powell #rates #FOMC $AAPL $NVDA $ES_F $NQ_F $TQQQ $SQQQ $SPXL $SPXS $VOO
Tweet media one
0
18
140
@ChartingProdigy
King of the Charts
4 months
My Elliott Wave Count not to be confused with imitations I predicted an $SPX rally to new ATHs after I called the Oct 27 bottom. S&P 500 will likely make a new ATH by next week hitting the upper channel (last post), then peak & reverse. My alternative EW count is $SPY peaked Wed
Tweet media one
0
16
137
@ChartingProdigy
King of the Charts
4 months
. SELL!!! QQQ SELL SIGNAL . My NASDAQ 100 Overbought / Oversold Model Triggered A Sell Signal for NDX by turning down at extremes. This signals a top or it can still form a divergence . $SPX $SPY $NDX $TQQQ $SQQQ $NQ_F $ES_F #BULLRUN2024 #Stockmarketcrash $AAPL $NVDA #SP500 $QQQ
Tweet media one
0
14
138
@ChartingProdigy
King of the Charts
6 months
. Hey Bears My Bull Count Doesn't Seem So CRAZY To You Now I tried to warn you about this rally. S&P 500 up 5% this week I warned that I covered my shorts last Thursday & Friday & went long, but many bears didn't heed the warning. Don't worry pullback coming . $SPX $SPY $QQQ
Tweet media one
0
19
141
@ChartingProdigy
King of the Charts
6 months
. Fed Pause / Market Bottom Last week I predicted a bottom on Friday or Monday. Bouncing off major support. Good shot S&P 500 is completing wave (4) and it rallies into the end of the year for w(5) to new ATHs on the Fed Pause I've been predicting for Nov 1. . $SPX $SPY $QQQ
Tweet media one
0
16
136
@ChartingProdigy
King of the Charts
4 months
Possible Double Top I called the day of the bottom on Oct 27th & predicted a rally to new ATHs for S&P 500. It played out. I expect profit taking in the new year. $SPX weekly has horizontal resistance overhead, the upper channel & a trendline from before the pandemic $SPY $QQQ
Tweet media one
0
26
137
@ChartingProdigy
King of the Charts
11 months
$QQQ $SPY $NDX $AAPL The #SP500 is extremely overbought. The last 2 times it was this overbought & at these extremes was at the top, when it formed a neg divergence & it crashed by -24.55%. Then at the August high, $SPX reversed reaching these extremes & crashed by nearly -20%.
Tweet media one
0
19
136
@ChartingProdigy
King of the Charts
1 year
$NDX $SPXS $QQQ $SQQQ $SPX $NQ_F #SP500 $AAPL $TQQQ #NASDAQ 100 weekly chart starts the week off with a bearish Stochastic cross, suggesting the another crash. Since I called the day of the top in Nov. 2021, each Stochastic crossover was followed by a crash (red circles). .
Tweet media one
0
19
135
@ChartingProdigy
King of the Charts
1 year
$SPY $SPXS $QQQ $AAPL $SPX #StockMarketcrash #SP500 It never ceases to amaze me how complacent people get at tops The $VIX has formed bullish divergences in the weekly timeframe, while the Herd is shuffling the deck chairs on the Titanic, oblivious to what is about to happen. .
Tweet media one
0
23
132
@ChartingProdigy
King of the Charts
4 months
. CRASH COMING!!! The S&P 500 is very overbought and at extremes once again. Major selloff coming soon! . $SPX $SPY $QQQ $NDX $AAPL #BULLRUN2024 #Stockmarketcrash $MSFT $NVDA $GOOG $TSLA $META $SPXL $SPXS $VIX $SPXS $SPXU $NQ_F $ES_F
Tweet media one
0
13
130
@ChartingProdigy
King of the Charts
4 months
. My Risk-Reward Model rolled over on Jan 2 to start the year. Tops are marked @ extremes or rollovers after extremes. Here we were @ extremes for 5 weeks. The rollover marked a top. #SP500 still may make an ATH & form a divergence like it did @ the Oct low in 2023 $SPX $SPY $QQQ
Tweet media one
0
20
134
@ChartingProdigy
King of the Charts
5 months
. #BTC CRASH BTC is finishing wave (c) of B. It will likely finish next week w/ the #Fed or negative #BitcoinETF news. Fed to throw cold water on 125BP of rate cuts in 24. Wave C will cause a #Bitcoin crash to 8K - 9K. Last time BTC was up 8 weeks in a row it crashed 40% #FOMC
Tweet media one
0
28
128
@ChartingProdigy
King of the Charts
4 months
SPY just had its biggest one day inflow in history of 20.8B. Last time 5 day inflows were this high on $SPY in 2018, it crashed the next 10 days by 12%. The $VIX went from 12 to 50. VIX currently @ 12. Friday $QQQ got it largest one day outflow 5.2B since the dot com bubble $SPX
Tweet media one
0
19
125
@ChartingProdigy
King of the Charts
1 year
$QQQ Every time VIX bounced off of its 2017 trendline or pullback towards it, a big selloff followed. Sometimes $SPX moved a bit higher, then sold off The last time $VIX moved just under it was on Feb 2, that day #SP500 peaked with the Feb top VIX moved slightly under today!
Tweet media one
0
26
127
@ChartingProdigy
King of the Charts
7 months
$SPX $SPY $QQQ $SPXL $ES_F See Ya I can't believe no one is reading this I called the top in July, the August bottom, then for a rally into Labor Day & then this selloff to the rising trendline & 200 day MA. My signals are AMAZING! The hourly chart VWAP support & resistance
Tweet media one
0
11
128
@ChartingProdigy
King of the Charts
1 year
$QQQ $TQQQ $SQQQ $NDX Stocks aren't equal on #NASDAQ100 . It is a weighted index. The stocks' weights in the index are based on their market cap. So a few stocks control it. Looking at all the stocks equally, it is not making new highs. That is a big problem & suggests a reversal
Tweet media one
0
20
124
@ChartingProdigy
King of the Charts
4 months
. On Oct 28, I posted my #Elliottwave count (not to be confused with imitations), announcing my call for a $SPY bottom on Oct 27 & a rally to new all time highs by the end of the year (link). Compare the charts, it played out just as I predicted $SPX $QQQ
Tweet media one
@ChartingProdigy
King of the Charts
6 months
. Stock Market CRASH Over Bottom Here Here's My #SP500 #Elliottwave Count. Not To Be Confused With Imitations $SPY Finished an ABC Correction Friday or Will Monday. Fed Pause & Rally Into The End of the Year to New ATHs, Then a Top & Bear Market CRASH on a Fed Pivot $SPX $QQQ
Tweet media one
0
65
394
0
20
125
@ChartingProdigy
King of the Charts
5 months
#FOMC rate estimate for 2024 could be a market mover tomorrow or w/ a post #Fed selloff. Powell likely to push back on the market pricing in 125BP rate cuts in 2024. In Sept the Fed estimate was 50BPs of cuts in 24. Another market top soon. My signals at extremes $SPX $SPY $QQQ
Tweet media one
0
26
118
@ChartingProdigy
King of the Charts
5 months
. In order for a big S&P 500 selloff to occur, VIX has to get a breakout of the bullish Falling Wedge pattern & jump above 13. The $VIX has to close above the 10 day MA (red line). High probability this happens this week. Trading requires Patience. . $SPX $SPY $QQQ $ES_F $SPXS
Tweet media one
0
14
124
@ChartingProdigy
King of the Charts
4 months
. I want to wish all my followers on X a very #MerryChristmas & prosperous New Year! For unto you is born this day in the city of David a Saviour, which is Christ the Lord. The Angels said, "Glory to God in the highest, peace on earth, and good will toward men." . $SPX $SPY $QQQ
Tweet media one
0
8
122
@ChartingProdigy
King of the Charts
1 year
$SPY $SPXS $QQQ My previous tweet showcased my Triangle wave B #Elliottwave ABC scenario for #SP500 Here is my alternative WXY count that has $SPX in a large ABC from the Aug high for wave Y. If correct the Feb high will hold & a 5 leg push down will unfold for wave C of Y
Tweet media one
0
15
119
@ChartingProdigy
King of the Charts
6 months
. My signals correctly called the day of the Oct bottom Now I'm predicting a MELT UP for the rest of the year likely to new ATHs after a pullback After the next pullback, the momentum for the rest of the year is all to the upside for the stock market . $SPX $SPY $QQQ $NDX $AAPL
Tweet media one
0
8
120
@ChartingProdigy
King of the Charts
5 months
. We are NOW at EXTREME GREED This is present at tops & is the 5th time we've reached Extreme Greed in just over 2 years 1st time Nov 21 - NASDAQ Top & S&P 500 Jan 22 Top w/ Divergence 2nd time Dec 22 Top 3rd time Feb 23 Top 4th time June & July 23 Tops 5th Now . $SPX $SPY $QQQ
Tweet media one
0
22
120
@ChartingProdigy
King of the Charts
1 year
$SPY $NDX $SPXS $SQQQ $BTC $SPXL $QQQ $AAPL $SPX #StockMarketcrash $SQQQ #SP500 $TQQQ $VIX Thank You To My First 4500 Twitter Followers Recently Reached. Thank You For Your Interest In My Work. Much Appreciated! Continued Success, Ron Walker PhD The Doctor Of Dump & Pump .
Tweet media one
0
3
118
@ChartingProdigy
King of the Charts
5 months
. The Dips Below 13 on the VIX Have Marked S&P500 Tops Since June The #SP500 Has A Bearish Rising Wedge & the $VIX has a Bullish Falling Wedge SPX & NDX Futures intraday signals are starting the week off turning bearish before the market opens . $SPX $SPY $QQQ $NDX $ES_F $NQ_F
Tweet media one
0
13
117
@ChartingProdigy
King of the Charts
1 year
$SPX $SPY $QQQ Bingo! The Debt Ceiling Talks Fall Apart I Warned You This Would Happen Investors have been way too optimistic. Hopes of a deal that hadn't happened. Republicans walk out of debt ceiling talks, say White House isn’t being ‘reasonable’
0
16
111
@ChartingProdigy
King of the Charts
5 months
. Happy Thanksgiving Risk Model Shortly After My Signals Called the Very Day of the Oct Bottom, the S&P 500 Moved into a Risk On Environment. Signals are now overbought, so I expect a pullback, likely a big one. Then New ATHs to Form A top in Q1 2024 . $SPY $SPX $QQQ $NDX $AAPL
Tweet media one
0
3
114
@ChartingProdigy
King of the Charts
1 year
$SPY $NDX $SPXS $SPXL $QQQ #stockmarket $SPX $SH $SPXU $ES_F #Elliottwave Today #SP500 probably completed wave 4 of C with a Gap & Trap. I believe we are now in wave 5 that will likely finish Monday or Tuesday. Which would complete wave 2. It will be followed by crash wave 3. .
Tweet media one
0
15
114
@ChartingProdigy
King of the Charts
1 year
Every time the VIX bounced off of its 2017 trendline or pullback towards it, a big selloff followed. Sometimes the $SPX moved a bit higher, then sold off The last time the $VIX tagged it was on Feb 2, that day #SP500 peaked with the Feb top correction made to the date here
Tweet media one
0
18
108
@ChartingProdigy
King of the Charts
10 months
$SPX $SPY $QQQ CRASH COMING The Buffett Indicator which is Market Cap to GDP, moved above 100%, & the tech bubble burst. When it reached 200% in Nov 2021, NASDAQ peaked. Then #SP500 in Jan 2022 Here, it is still higher than the tech bubble, warning a bigger crash is coming.
Tweet media one
0
24
110
@ChartingProdigy
King of the Charts
5 months
. I'm Back Wow! What A Great Episode of the Rifleman! Major reversal signal for the #SP500 & the #NASDAQ100 as they both have negative divergences with their equal weight indexes. This is signaling a coming reversal that will likely give the market a higher low . $SPX $SPY $QQQ
Tweet media one
0
12
111
@ChartingProdigy
King of the Charts
5 months
. #Bitcoin is slamming into resistance forming negative divergence (link below) as the Moonboy Oscillator has formed a negative divergence at extremes, warning of another $BTC Top I predicted this rally but I also predict it will fail . #BitcoinETF #BTC
Tweet media one
@ChartingProdigy
King of the Charts
5 months
Bitcoin CRASH Soon #Bitcoin is now at major resistance forming multiple points of negative divergences on the Money Flow, MACD & RSI, as the Moonboys get the Vapors as $BTC advances on declining volume Signals will trigger a dramatic CRASH giving the dumb money a reality check
Tweet media one
0
21
111
0
19
110
@ChartingProdigy
King of the Charts
11 months
$QQQ $SPY $SPX The Fear & Greed Index reached Extreme Greed EG above 75 on Wed & Thur. Each time it has done that in the last year+, it has marked the top within days or that very day In Dec 1 it reached EG marking the day of the top. On Feb 1 it reached EG & peaked the next day
Tweet media one
0
20
109
@ChartingProdigy
King of the Charts
5 months
Bitcoin CRASH Soon #Bitcoin is now at major resistance forming multiple points of negative divergences on the Money Flow, MACD & RSI, as the Moonboys get the Vapors as $BTC advances on declining volume Signals will trigger a dramatic CRASH giving the dumb money a reality check
Tweet media one
0
21
111
@ChartingProdigy
King of the Charts
1 year
$SPY $SPXS $QQQ $AAPL $SPX #StockMarketcrash #SP500 Happy Mother's Day to all you Moms in Twitterland! You have the most important job in the world! Happy Mother's Day to my Mom who is in Heaven. I Love You Mom & Miss You So Much! Love, Ron
0
2
110
@ChartingProdigy
King of the Charts
1 year
$SPY $NDX $SPXS $SPXL $QQQ $AAPL $SPX $SQQQ #SP500 $TQQQ $VIX #NASDAQ $QLD #NASDAQ100 daily chart is forming a 9 Count Signal in the daily today. This bearish signal shows price exhaustion. It already formed a 9 Count Signal in the weekly last week. This is a bearish signals .
Tweet media one
0
7
106
@ChartingProdigy
King of the Charts
1 year
$SPY $NDX $SPXS $SQQQ $BTC $SPXL $QQQ $AAPL $SPX #StockMarketcrash $SQQQ #SP500 $TQQQ $VIX $SPXU Thank You To My First 3500 Twitter Followers Reached Today. Thank You For Your Interest In My Work. Much Appreciated! Continued Success, Ron Walker PhD The Doctor Of Dump & Pump .
Tweet media one
0
5
107
@ChartingProdigy
King of the Charts
6 months
. I'm back! S&P 500 closes the session out with negative divergence at resistance in the 5, 15, 30 & 60 minute timeframes. High probability the market either peaked today or will tomorrow morning to be followed by a pullback for a higher low. . $SPX $SPY $QQQ $NDX $SPXL $SPXS
Tweet media one
0
8
107
@ChartingProdigy
King of the Charts
4 months
Last 4 times the RSI on Russell 2000 daily reached extremes it marked a top. Since 2021, this is the 5th time the RSI is at extremes above 70 (it also has negative divergence). Each time it marked a top & was followed by a crash. $SPX likely makes a new ATH 1st . $IWM $QQQ $SPY
Tweet media one
0
18
102
@ChartingProdigy
King of the Charts
5 months
. We MUST be Near or at a Top The Bulls Are Giving Me Free Hate Just As The Bears Did When I Called The Oct Bottom Video Here It is so fun having darts thrown at you for having the guts to call tops & bottoms AS I DID IN JULY & OCT . $SPY $SPX $VIX $QQQ
Tweet media one
0
10
101
@ChartingProdigy
King of the Charts
1 year
$SPY $SPXS $QQQ $VIX $SPX $AAPL #SP500 The prudent sees danger & take cover, but the naive goes blindly on & suffer the consequences - King Solomon The Wisest Man Interpretation Don't stand in front of a freight train Those ignoring the danger signs will pay a penalty for it
Tweet media one
0
12
102
@ChartingProdigy
King of the Charts
5 months
. I've Now Called The Day of The July Top & Day of the Oct Bottom - Signals Warn Pullback Coming Stock Market CRASH Grand Finale To Be Followed By The Mother of All Melt Ups To New ATHs Video Here . $SPX $SPY $QQQ $NDX $VIX $NVDA $AAPL #stockmarketcrash
Tweet media one
0
9
100
@ChartingProdigy
King of the Charts
6 months
. Thank You To My First 8000 X Followers Just Reached. Thank You For Your Interest In My Charts. Much Appreciated! Success Ron Walker PhD The Doctor Of Dump & Pump . $SPY $NDX $SPXS $SQQQ $BTC #Bitcoin $QQQ $AAPL $SPX #StockMarketcrash $NVDA #SP500 $TQQQ $VIX $NVDA $ES_F $SPXL
Tweet media one
0
0
101
@ChartingProdigy
King of the Charts
5 months
. #SP500 4 Hr Signals Turning Bearish Check List ------ Break of Green Cloud - Red Cloud Appears Break Below Green Dots - Red Dots Appear Dropping Below Support Line - Support Line Turns Red Oscillator Goes Negative & Confirms The Signal . $SPX $SPY $QQQ $NDX $ES_F $AAPL
Tweet media one
0
5
98
@ChartingProdigy
King of the Charts
6 months
Fed Pause Coming NASDAQ Rally To ATHs Here's My Bullish #NASDAQ100 #Elliottwave Count, Not To Be Confused With Imitations. I Have An ABCDE Triangle Correction To Complete (5) Waves of W 5 of V That Will End The Bull Market. Bear Market To Follow $SPX $SPY $QQQ $NDX $TQQQ $SQQQ
Tweet media one
0
15
97
@ChartingProdigy
King of the Charts
10 months
$SPY $QQQ $SPXS $VIX $TSLA $AAPL $SPXL $SPXS $SQQQ High Probability A CRASH Starts Next Week #SP500 & #NASDAQ #StockmarketCRASH Could Start On or By July 19 or July 20 IF a reversal starts Monday $SPX could BEGIN a CRASH move by Wednesday July 19 or Thursday July 20 .
Tweet media one
0
16
99
@ChartingProdigy
King of the Charts
5 months
. In addition to the H&S pattern & Bear Flag forming(last 2 posts), S&P 500 is also getting a bearish MACD cross today on the daily chart. I told you yesterday I was expecting that today. For the signal to play out, $SPX has to drop below its 10 day MA (red line . $SPY $QQQ $ES_F
Tweet media one
0
15
97
@ChartingProdigy
King of the Charts
1 month
. The S&P 500 weekly has formed triple negative divergence, with new highs on declining volume. One of the strongest sell signals in TA. Because a selloff doesn't immediately occur, the Herd becomes complacent, coming to the false conclusion that it won't selloff . $SPX $SPY $QQQ
Tweet media one
0
16
101
@ChartingProdigy
King of the Charts
1 year
$SPY $NDX $SPXS $SPXL $QQQ $AAPl $SQQQ #SP500 $VIX The gap & fill on $SPX at the open was followed by a bear flag that evoloved into a H&S pattern or could also qualify as a bearish Descending Triangle. Break down of the pattern has taken place the last few minutes of trading
Tweet media one
0
8
98
@ChartingProdigy
King of the Charts
6 months
. Here's what I've been predicting would happen for S&P 500. In my video last week, I predicted the mother of all rebounds to form a massive inverse H&S pattern. That is likely. Overhead resistance & gap fill will likely end the rally. Then about a 200pt pullback $SPY $SPX $QQQ
Tweet media one
0
9
102
@ChartingProdigy
King of the Charts
5 months
. Wishing My Viewers a Happy Thanksgiving! I'm Thankful That You're Following Along! S&P 500 Intraday . $SPY $SPX $QQQ $NDX $SPXU $SPXL $SPXS $NVDA $AAPL $VIX #SwingTrading #stockmarketcrash #bullmarket #bearmarket #blackfriday #stockmarket $TQQQ $SQQQ $ES_F $NQ_F
Tweet media one
0
1
101
@ChartingProdigy
King of the Charts
5 months
. Sellers will come in this week to #Bitcoin near 46K to 47K @ upper boundary of the channel The last time $BTC rose 8 straight weeks in a row, it was followed by a rapid 40% crash It will selloff w/ the Fed throwing cold water on 125BP of cuts in 24 or negative #BitcoinEtf news
Tweet media one
0
16
97
@ChartingProdigy
King of the Charts
1 year
$SPY $SPXS $SPXL $QQQ $VIX $ES $SPXU $AAPL My Accumulation/Distribution indicator on the #SP500 shows we've started Distribution this week. That means there is a very good chance that the top is in from April 18th. That is the day $SPX tested the 400 MA with a black candle .
Tweet media one
0
7
95
@ChartingProdigy
King of the Charts
6 months
. NASDAQ UP 10.50% Since I Called the Bottom Very Important Video Here Again, I remain BULLISH, but believe a big pullback is coming. Likely next week. In Sundays video I'll be sharing an Important reversal signal . $SPX $SPY $QQQ #BullMarket $ES_F $NQ_F
Tweet media one
0
8
95
@ChartingProdigy
King of the Charts
1 year
$SPY $NDX $SPXS $SQQQ $BTC $SPXL $QQQ $AAPL $SPX #StockMarketcrash $SQQQ #SP500 $TQQQ $TSLA $VIX Thank You To My First 2000 Twitter Followers Reached Today. Thank You For Your Interest In My Work. Much Appreciated! Continued Success, Ron Walker PhD The Doctor Of Dump & Pump .
Tweet media one
0
1
95
@ChartingProdigy
King of the Charts
4 months
. S&P 500 very likely to reach a new ATHs soon & the upper boundary of the channel as I predicted back at the bottom on Oct 27. That will likely trigger a massive selloff in early January. $SPX could form a major top with a Double Top pattern. . $SPY $QQQ $ES_F $AAPL $SPXL $SPXS
Tweet media one
0
17
95
@ChartingProdigy
King of the Charts
11 months
$QQQ $SPX #NASDAQ100 has rallied up between the 61.8% & 78.6% fibs. There it is testing 2 trendlines. One from the ATH. The other from the high just before the pandemic, which has acted as support & resistance (arrows) $NDX stopped at the place where these 2 trendlines intersect
Tweet media one
0
12
94
@ChartingProdigy
King of the Charts
1 year
$SPY $NDX $SPXS $SQQQ $BTC $SPXL $QQQ $AAPL $SPX #StockMarketcrash $SQQQ #SP500 $TQQQ $TSLA $VIX Thank You To My First 2500 Twitter Followers Reached Today. Thank You For Your Interest In My Work. Much Appreciated! Continued Success, Ron Walker PhD The Doctor Of Dump & Pump .
Tweet media one
0
3
94
@ChartingProdigy
King of the Charts
10 months
$SPX $SPY $QQQ The #SP500 will most likely close with a Doji marking the top. #NASDAQ may finish with a Gravestone Doji. Setting up for a big crash next week to fill the gaps earlier this week. I expect a violent crash next week that will start Monday & escalate by Wednesday
Tweet media one
0
15
94
@ChartingProdigy
King of the Charts
4 months
S&P 500 is in a topping process. $SPY either peaked & will form a lower high or get one more rally with the #PCE inflation tomorrow. Then likely selloff over holiday trading. $SPX could make a new ATH now or in 2024. A divergence below, it could form a triple divergence . $QQQ
Tweet media one
0
9
94
@ChartingProdigy
King of the Charts
5 months
. So far, the rally fizzled after testing last weeks high & setting up a lower high. In order for #SP500 to selloff, it has to break the 20 MA here at 4540 (arrow). Notice the oscillator was negative during entire decline from July to Oct. Trading requires patience $SPX $SPY $QQQ
Tweet media one
0
6
94
@ChartingProdigy
King of the Charts
7 months
According to Forbes @elonmusk is the richest man in the world once again. Years ago, the world's previous richest man gave the BEST trading advice I've ever heard regarding risk & danger (read it below). His words of wisdom inspired my creation of this RISK MODEL $SPX $SPY $QQQ
Tweet media one
0
7
92
@ChartingProdigy
King of the Charts
4 months
. Stock Market Dump Coming Signals are Warning Likely A New All Time High First for S&P 500 Video Here My prediction from the Oct bottom has played out (link below) - Merry Christmas Everybody . $SPX $SPY $QQQ $NDX $AAPL $ES_F
Tweet media one
@ChartingProdigy
King of the Charts
4 months
. On Oct 28, I posted my #Elliottwave count (not to be confused with imitations), announcing my call for a $SPY bottom on Oct 27 & a rally to new all time highs by the end of the year (link). Compare the charts, it played out just as I predicted $SPX $QQQ
Tweet media one
0
20
125
0
10
94
@ChartingProdigy
King of the Charts
1 year
$SPY $SPXS $SPXL $QQQ $UVXY $SQQQ $ES $AAPL $SPXU #SP500 $SPX $TSLA $DIA $YM #FOMC #Powell THIS TIME IS DIFFERENT! Yeah Right! As I've Been Warning The #STOCKMARKETCRASH is Here We will likely start a powerful countertrend rebound later today or tomorrow with the #Fed .
Tweet media one
0
8
94
@ChartingProdigy
King of the Charts
4 months
. Thank You To My First 11K Followers Recently Reached On X. Thank You For Your Interest In My Charts. Much Appreciated! Success, Ron Walker PhD The Doctor Of Dump & Pump . $SPY $NDX $SPXS $BTC #Bitcoin $QQQ $AAPL $SPX #StockMarketcrash #SP500 $NVDA $ES_F $NQ_F #BULLRUN2024
Tweet media one
0
4
91
@ChartingProdigy
King of the Charts
6 months
. My Call For A Bottom Last Friday Looks Correct Here's my speculative #Elliottwave Count Big picture last tweet Watch the gap fill overhead. I expect a pullback for a higher low, then a big rally after that. Neg divergences will form wave 2 . $SPX $SPY $QQQ #FOMC #Powell
Tweet media one
0
15
94