

The COVID Tracking Project
@COVID19Tracking
Followers
341K
Following
58
Media
1K
Statuses
3K
We try to provide the most comprehensive state-level coronavirus data. Housed at @TheAtlantic.
Joined March 2020
Our daily update is published. States reported 1.2 million tests, 41k cases, 40,212 hospitalized COVID-19 patients, and 839 deaths. This is our final day of data collection after a very long year.
738
1K
6K
We looked to automation as a way to support and supplement the manual work of our volunteers, rather than replace it. This kept us focused on making sure we understood the data & the conclusions we could draw from it, especially as the pandemic evolved.
32
16
81
From March 2020 to March 2021, our volunteers spent well over 20,000 hours manually entering data. In this post, we talk about why we chose not to automate our data collection.

covidtracking.com
89
65
197
We also link to in-depth resources, both from our own site and from others. Ultimately, what we’ve learned is that when people understand why public health metrics are complicated, trust in the data reporting process grows.

covidtracking.com
11
15
39
It’s been valuable for us to revisit our year with COVID-19 data. In this post, we dig into our history of reporting tests, cases, deaths, hospitalizations, and recoveries, and we explore the definitional problems that regularly challenged our analysis.
16
12
30
Our data collection ended in March, and soon, the full @COVID19Tracking project will come to a close. In this summary post, we look at how states reported the 5 major COVID-19 metrics & how reporting complexities shaped our understanding of the pandemic.
covidtracking.com
33
47
139
The catch? The pipelines needed to send antigen test results to health officials are brand new. It’s likely we’ll never know just how many people with positive antigen results should have been counted as probable cases.
3
5
21
What we found was that a state’s testing strategy played an important role in shaping probable case counts. States with strong antigen testing programs no longer had to rely on contact tracing and symptom tracking, both difficult to perform at scale.
7
9
21
When states started updating their probable case definitions, as per guidance from the feds, the share of probable cases in their total case counts grew. Our research set out to explore the extent to which this growth was fueled by antigen tests alone.
1
2
11
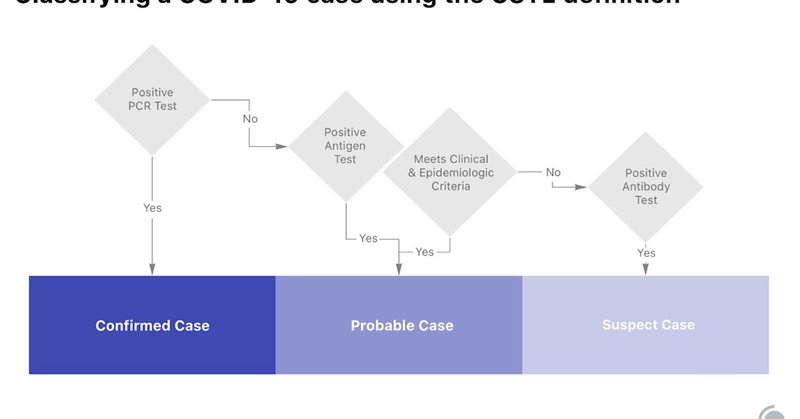
As we’ve seen with many COVID-19 metrics, there’s often a veneer of uniformity obscuring quiet data discrepancies. In this piece, we look at probable COVID-19 case definitions and the decisions states made about how and when to adopt federal guidance.
covidtracking.com
When analyzing COVID-19 data, confirmed case counts are obvious to study. But don’t overlook probable cases—and the varying, evolving ways that states have defined them.
10
27
71
The inability to track death trends when it mattered most speaks to some of the greatest failures in the US handling of COVID-19: the incalculable tragedy of the lost lives & the infrastructure unable to collect data that might have informed a response and prevented such loss.
3
31
91
Twice, the nation’s infrastructure was so overwhelmed that the death tally hit a ceiling, reflecting how many deaths out of the true total the US could count. Large backlogs of deaths from the winter were still being processed 4 months after the true peak.
2
19
57
Real-time death counts were affected by both slowness in reporting, which made peaks in deaths appear like they happened later than they did, and by reporting capacity limits, which made deaths look like they peaked lower than they did.
1
4
17
To understand the effect of reporting lags on state COVID-19 death counts, we compared data compiled by the CDC from state dashboards to retrospective data published by some states that charts deaths on the day they actually occurred.
3
7
21
During the worst moments of the pandemic, the US public health data infrastructure could not keep up with COVID-19 death counts. Our new analysis looks at the effect of reporting lags on death data reported by states and the CDC:
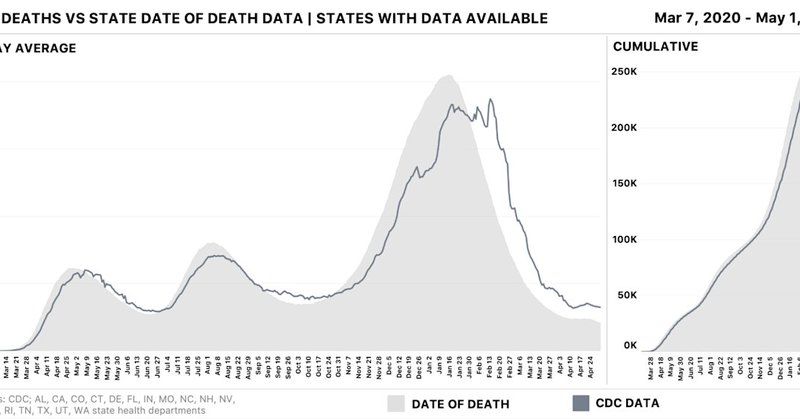
covidtracking.com
During the worst parts of the COVID-19 pandemic, the United States struggled to keep up with COVID-19 death counts.
11
88
159
Our latest post digs into these issues and explores the tradeoffs we made in order to publish the best possible historical data.

covidtracking.com
Throughout our year of tracking COVID-19 tests, cases, and outcomes, we were confronted with data organized by numerous dating schemes. Here’s how we came to understand those dating schemes, and the...
2
18
51
Time series charts can provide context on the progression of the pandemic. But presenting a sound time series requires wrestling with data delays, uneven reporting, and different methods of assigning data to dates.
5
16
83
In this post, we detail how and why we built our screenshots system. We also hope to offer guidance for any future data collection project that relies on maintaining the provenance, history, and accuracy of data.
1
10
49
After months of work, with hundreds of scripted screenshots and dozens of manual screenshots, we reached 100% coverage of our 797 core testing and outcomes data points.
1
3
45
One of the foundational principles of The COVID Tracking Project is data transparency. We set out to take screenshots of state COVID-19 websites and dashboards to create an archive, show where our data came from, and maintain data history.
1
20
77
We did what we could to explain the data to the people who wrote us, but the people who wrote us also helped us correct errors and understand our own data better. Here’s an inside look at our public help desk.
covidtracking.com
3
10
51