

Christof Gaenzler
@CGaenzler
Followers
331
Following
567
Media
197
Statuses
830
LifeScience data analytics nerd — PhD in Molecular Biology -- Opinions are my own.
US
Joined October 2011
Looking forward to our first ever in-person User Group Meeting and excited that @KevinHanegan will give the keynote at the #ZONTALUGM #DataAnalytics #DataLiteracy #DataVisualization.

🗓️ Save the Date! ZONTAL User Group Meeting on Oct 3rd, 2023, Novartis Pavillon Basel. Don't miss this chance to connect with experts, explore the 2024 product roadmap, and shape the future of data in Life Science R&D. #ZONTALUGM #DataScience #FAIRdata.
0
0
0
I am happy to share my most recent article "FAIR Game: making data work harder in the race to market" published in @DDWJournal @PKI_Informatics #drugdiscovery #science #fair #data #analysis #Workflow #informatics #collaboration #Software #CloudNative .

ddw-online.com
In today’s quest to accelerate time to market for novel drugs, part of the success formula requires leveraging discovery data with more precision and speed, and earlier in the process.
1
1
4

Blazing-fast image creation – using just your voice. Try Grok Imagine.
284
557
3K
I am pleased to be participating in the #BioIT2022 World conference. Join me on May 4th at the 1pm luncheon where I will be presenting on how to solve the dilemma of Assay Data Analysis. (Track 2).Don´t forget to visit us at the booth #908. @PKI_Informatics

0
1
3
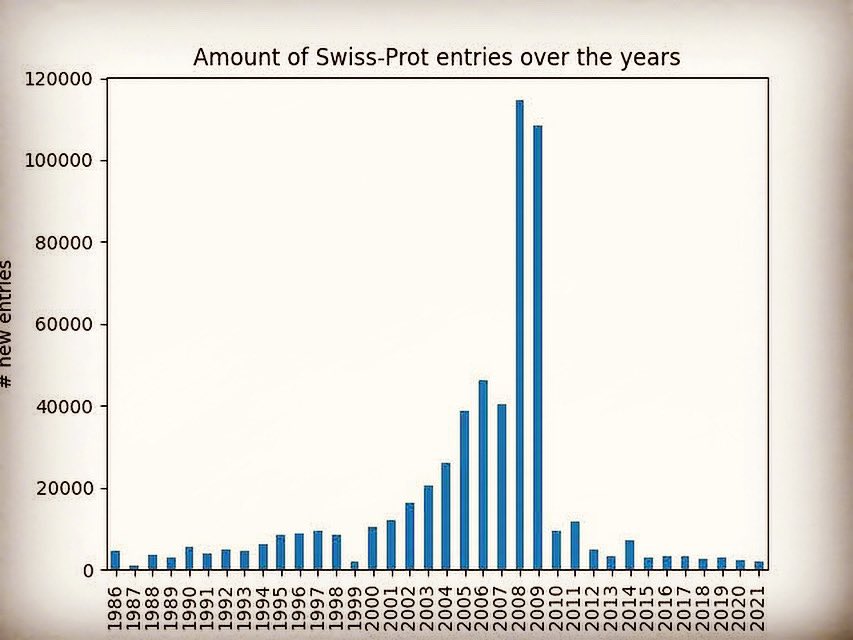
I wanted to know how many Swiss-Prot #protein entries there have been per year in the #database - #biologyhistory! Quick #biopython #pythonprogramming #weekendfun #bioinformatics #coding on my #raspberrypi - sorry no #spotfire this time
0
7
4
my #raspberrypi can do #clustalw ! Multiple sequence alignment of spike proteins from #swissprot - visualized in alan - #weekend #Bioinformatics

1
6
25
Join @PKILifeScience Tutorial @SLAS_Org.Wed Feb 9 8:30am-10am ET, Location:104B .-Lab of the Future- Automating Assay Development: Novel Data Driven Workflow for Protein-Protein Interaction (PPIs) Assays #LabAutomation #DataAnalytics #LaboftheFuture.
0
0
2
The combination of SnapGene and Geneious Prime software with the PerkinElmer Signals platform powerfully enhances research workflows and enriches collaboration. Ultimately this will better connect scientists to their ideas and data, so they can focus on.
0
0
0
Tomorrow I will present in a @Tech_Networks webinar for @PKI_Informatics :. "Creating the New Gold Standard in Assay Data Management & Analysis". WEBINAR 20 Oct 2020 at 17:00 (GMT +02:00)

0
1
1
RT @PKI_Informatics: In 1854, John Snow developed the process of #epidemiology. Today, our lives depend on it. htt….
0
1
0
RT @PKI_Informatics: The world is depending on #science now more than ever. TIBCO’s Michael O’Connell returns with PerkinElmer’s Dan Weaver….
0
4
0
RT @DrSpotfire: Join @PKI_Informatics for #Spotfire Open Office Hours. Next session starts Thursday at 8AM Pacific!. Sign up 👉 https://t.….
0
1
0
RT @PKI_Informatics: In this time of working differently, come join us for SPOTFIRE OPEN OFFICE HOURS, a place for our scientific community….
0
2
0
read our latest @Tech_Networks article @PKI_Informatics Signals™ Screening for HTS, HCS, SPR built on @TIBCO #Spotfire. Find out more about how @PerkinElmer Signals Screening can streamline and improve your #HTC, #HCS, and #SPR workflows.

0
1
4
Wed May 27th, 11am EDT .Webinar: Enabling Macro and Micro Insights into the #COVIDー19 #pandemic through the Power of #VisualAnalytics .-->.<--.@TIBCO #Spotfire @MichOConnell .@PKI_Informatics @PerkinElmer @IsmailIjjaali .@AmerChemSociety @CASChemistry

0
0
0
Today we released @PerkinElmer @PKI_Informatics Signals Screening 2.4.1 with an Editable Data Grid in @TIBCO #Spotfire. Our new Calculation Explorer includes an overhaul of the core curve fitting engine and algorithm w/ Levenberg-Marquadt algorithm & IRLS

0
3
9

Today's Quick Tip in #Spotfire. Doing Heatmaps and Contours on #maps with #Airbnb data. #geoanalytics #dataviz #analytics #bi #gis
0
0
1
I've had a couple of questions about the chart on the right: it is a ScatterPlot in @TIBCO #Spotfire using tiled markers as a shape. I am happy to share the file, DM me if you'd like to have it and BTW Spotfire 7.11 LTS can read files from Spotfire 10.3.1 LTS @PKI_Informatics.
@PKI_Informatics @TIBCO #Spotfire showing trends for leading causes of death by US state. Overall trend shown as white line-individual trends per state as green straight line fits. Downward trends per state/condition are indicated as green color on maps

0
2
6
