

Blake Robert Mills
@BlakeRobMills
Followers
2K
Following
4K
Media
115
Statuses
365
Data Scientist ~ Cities + Statistics + Art ~ ABBA Enthusiast ~ #MetBrewer Creator ~ Cowboy at Heart ~ 🏳️🌈
NYC
Joined April 2021
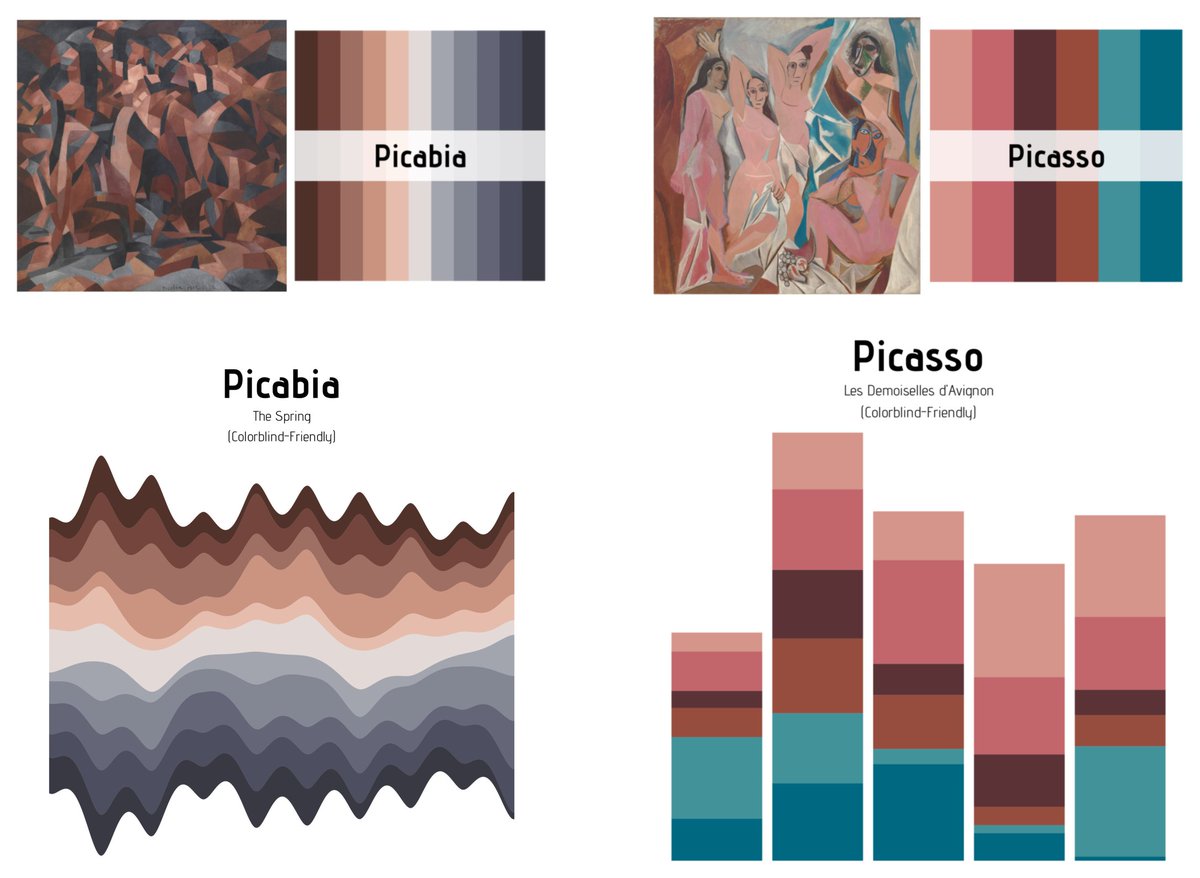
✨✨ New Package ✨✨.Happy to announce that I am soft launching another R color palette package, {MoMAColors} today! Currently has 35 palettes based around artwork at @MuseumModernArt. Download Instruction and Palettes here: #r4ds #dataviz #rstats


27
483
3K
RT @AchimZeileis: PSA: All #rstats package on #cran will get an official DOI!. This will facilitate bibliometrics and giving credit to R pa….
0
236
0
RT @gonzaloyaniz: Today I bring you a little passion project: GhibliBrewer, an R package by @javiml221098 and me, to create color palettes….
0
7
0
RT @juliagdealedo: 🔉Next stop. MetroBrewer! 🚉 . 📦New package for #rstats developed by @iramosgutierrez and me! .📊Plot your graphs using y….
0
24
0
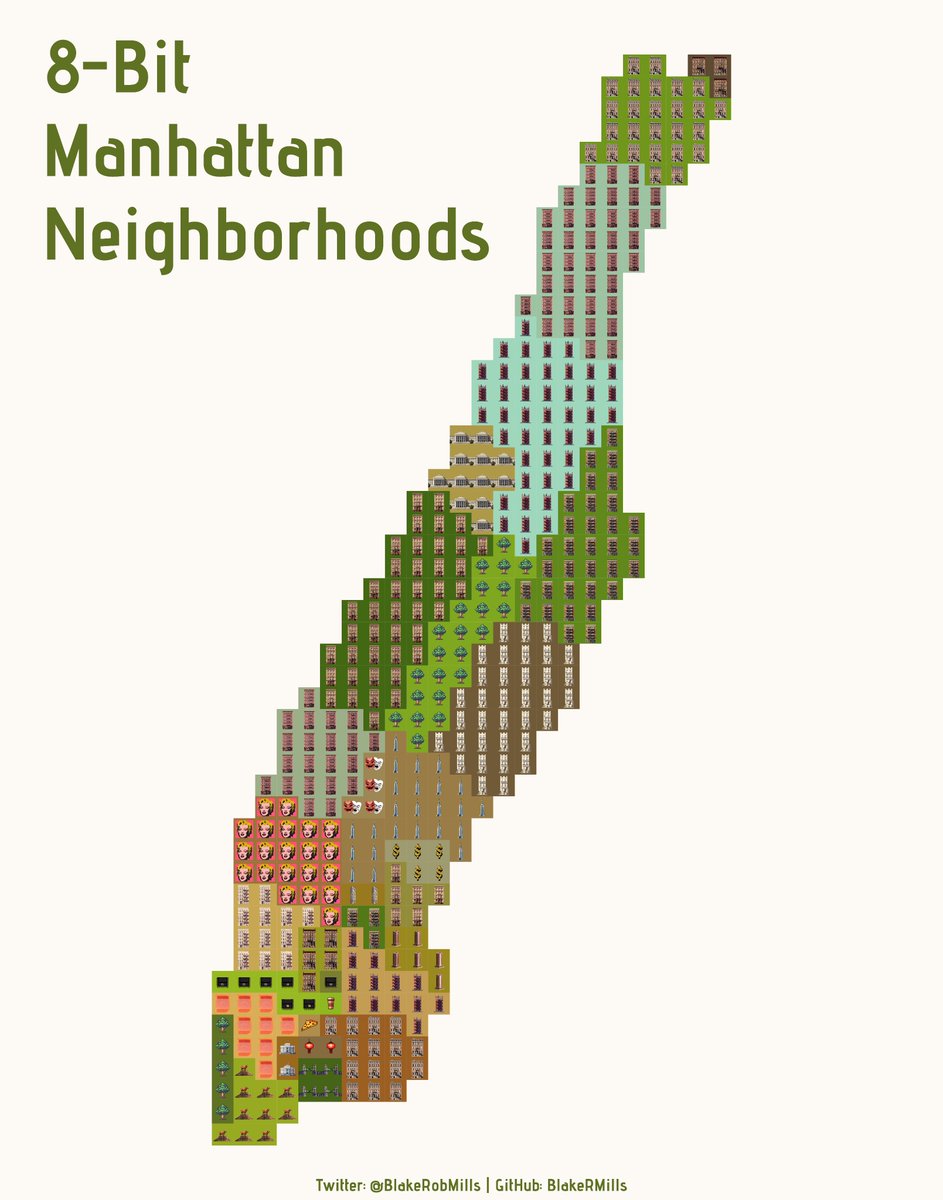
Still finishing a few maps I missed. Day 26 of the #30DayMapChallenge - Minimal. Spent forever creating the 8-bit icons for this Manhattan Map. Highly encourage everyone to check out the full image for detail!. Code: Full Image:

1
0
18
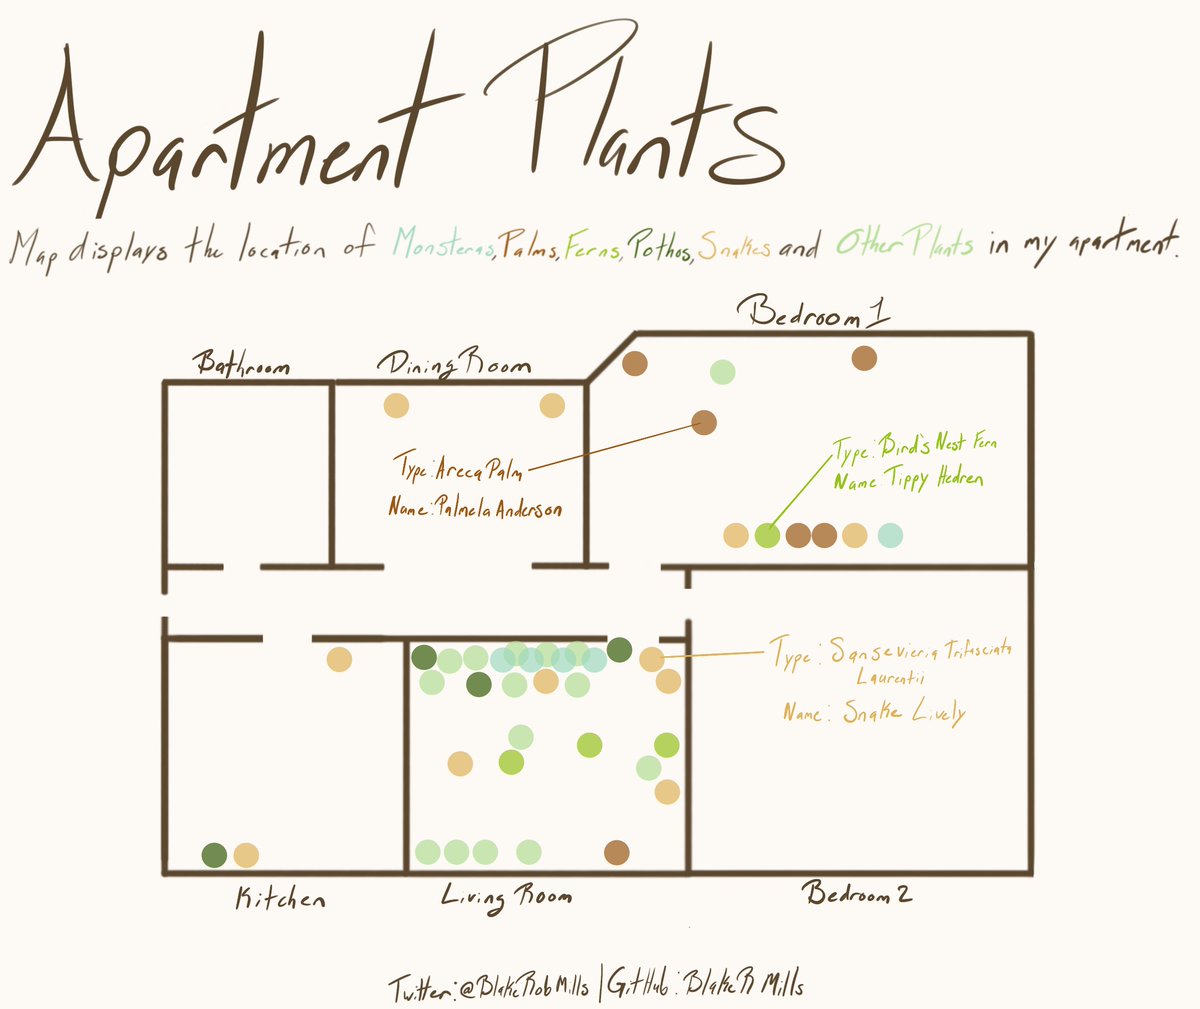
Using today to finish my skipped entries. Day 5 of the #30DayMapChallenge - Analog Map. Map shows the location of plants in my apartment. Slightly cheated using Procreate, but that is my true, messy handwriting 🪴🌿🌵. Full Image:
0
3
15
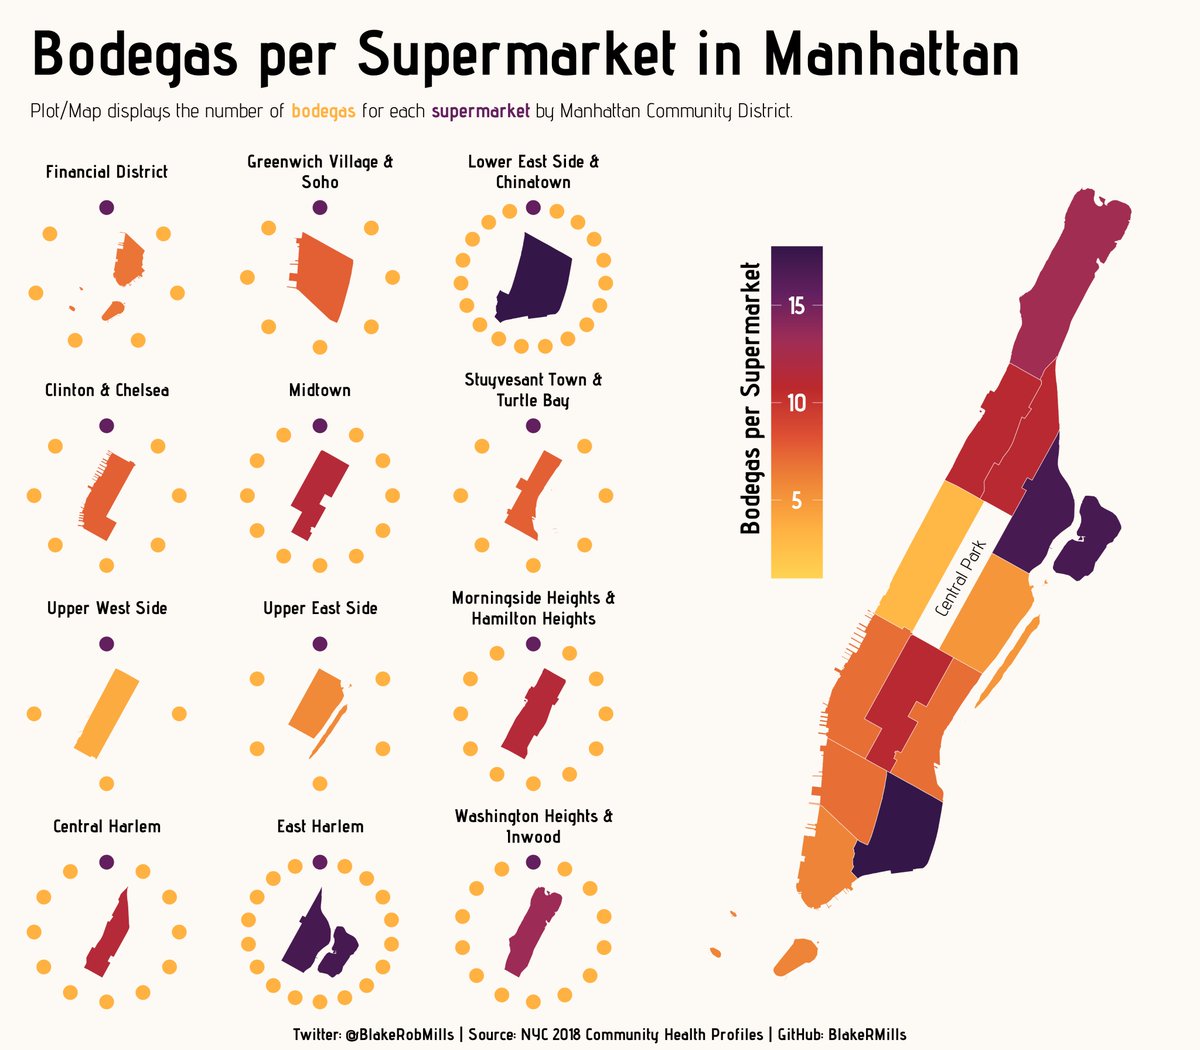
Day 28 of the #30DayMapChallenge - Is this a map or a chart?. Map/chart shows the number of bodegas for each supermarket in Manhattan. Code: Full Image: . #rstats #dataviz #tidyverse
0
1
29
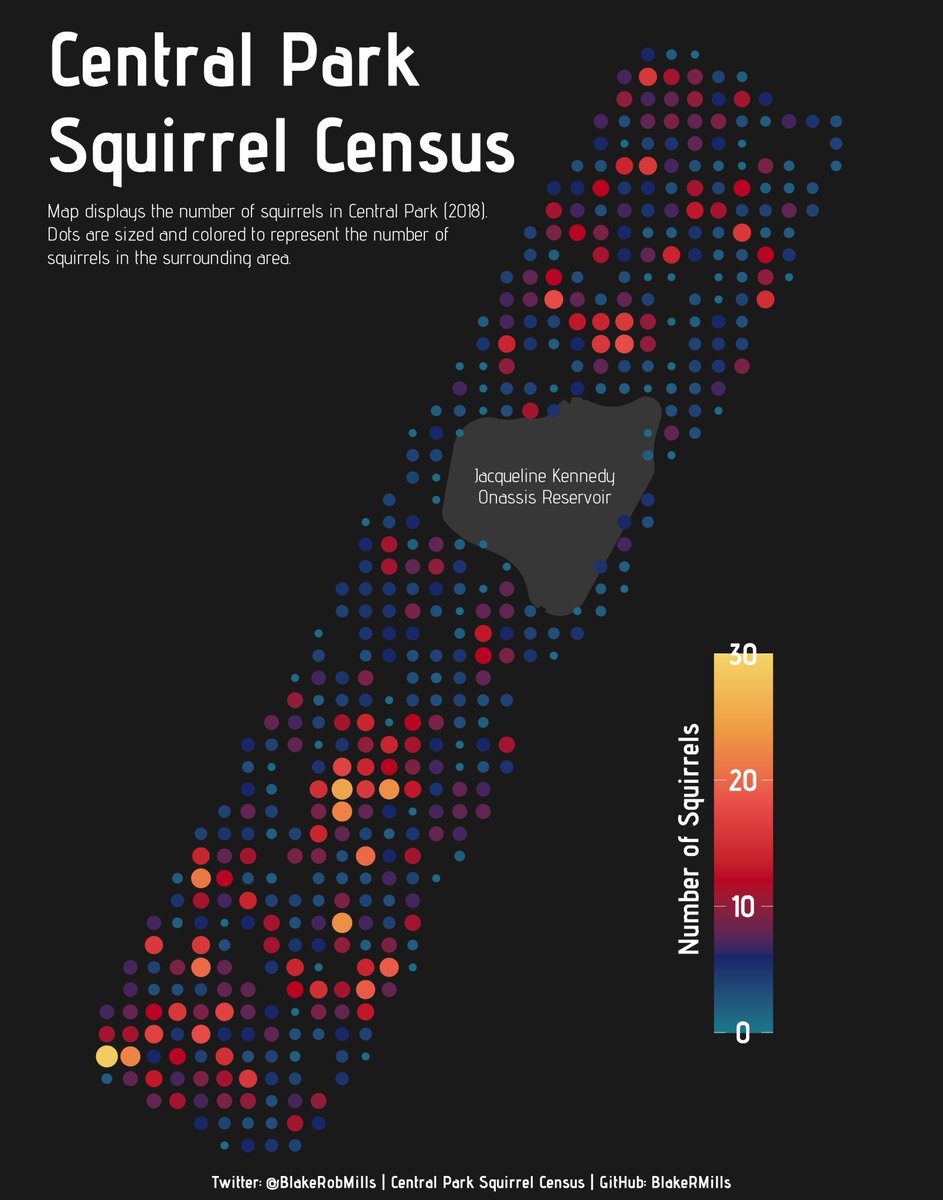
Day 29 of the #30DayMapChallenge - Population. Map shows number Squirrels in Central Park from the 2018 Squirrel Census 🐿️🐿️ . Code: Full Image: #rstats #dataviz #tidyverse #MoMAColors
0
5
70
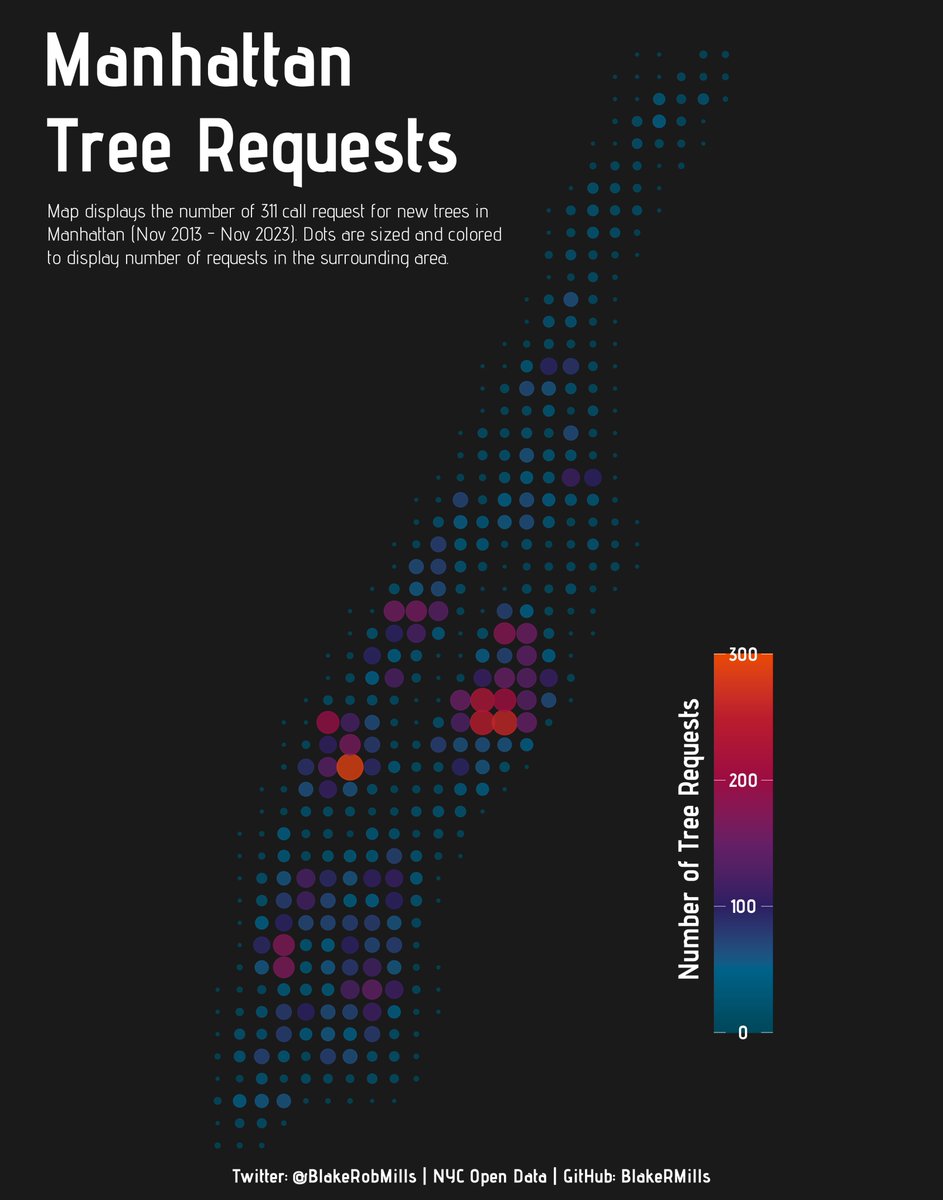
Day 27 of the #30DayMapChallenge - Dot. Map shows number of 311 call requests for new trees in Manhattan. Code: Full Image: #rstats #dataviz #tidyverse #MoMAColors
0
1
20
Day 25 of the #30DayMapChallenge - Antarctica. Map shows earthquakes around the continent. Code: Full Image: #rstats #dataviz #tidyverse #MoMAColors

0
0
11


1
3
28
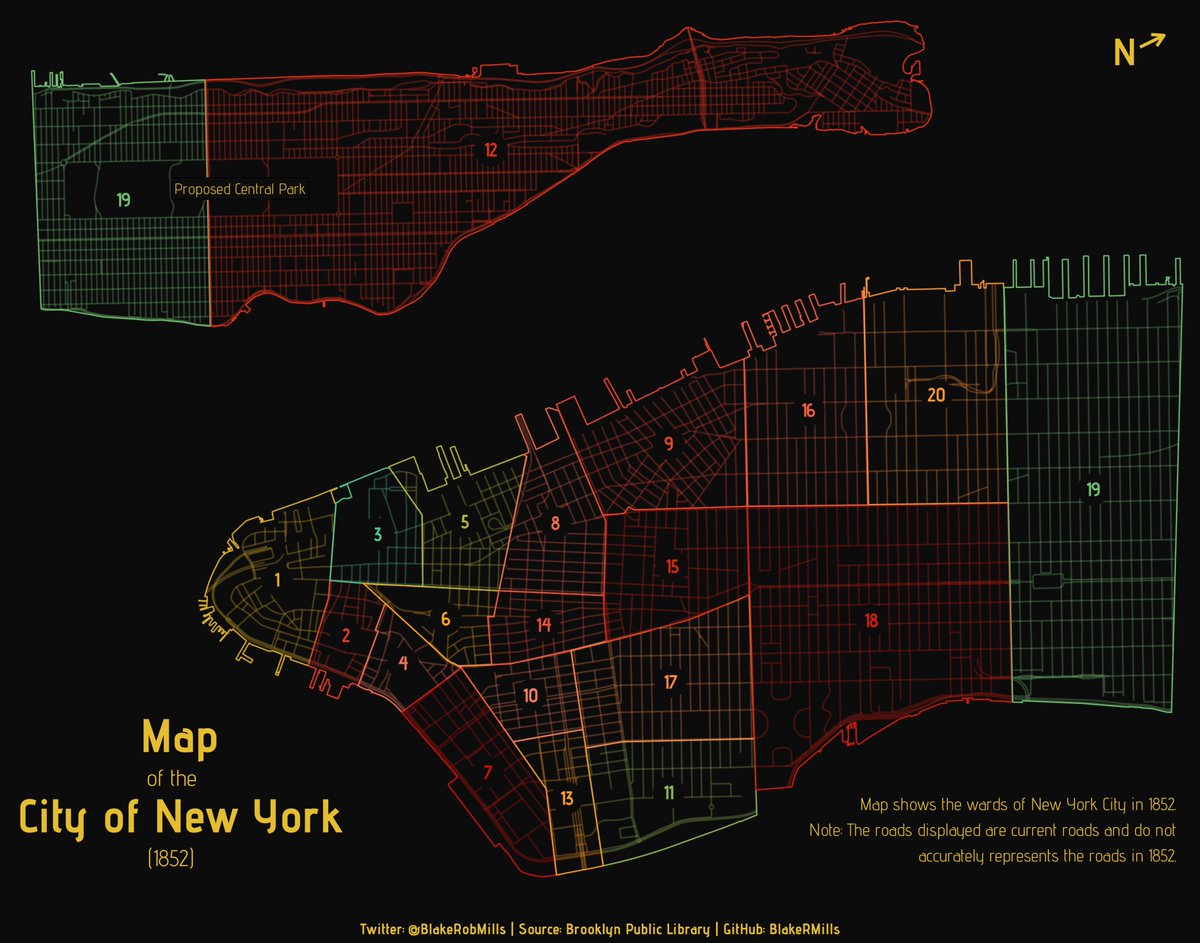
Based on this 1852 Map of New York City from the Brooklyn Public Library.

0
0
1
Day 22 of the #30DayMapChallenge - North is not always Up. Map shows the wards of NYC in 1852 based on a map at the Brooklyn Library (linked in comments)!. Code: Full Image: #rstats #dataviz #tidyverse #MoMAColors
1
2
24


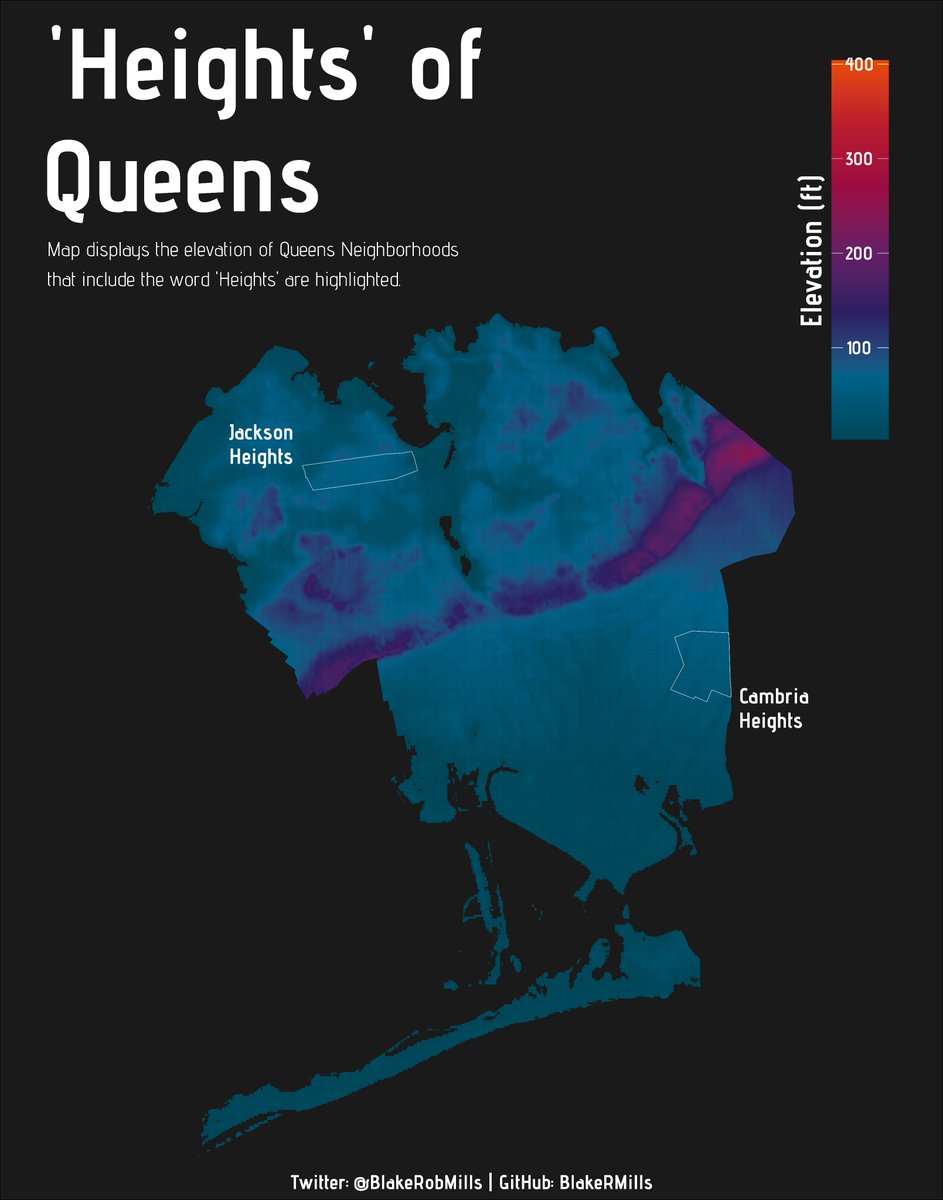
Day 21 of the #30DayMapChallenge - Raster. Maps shows the elevation of NYC boroughs and all neighborhoods with the name "Heights." . Code: . Full Image: . #rstats #dataviz #tidyverse #MoMAColors


2
2
28
Day 20 of the #30DayMapChallenge - Outdoors. Map shows the vegetation of Great Smoky Mountain National Park. Code: Full Image: #rstats #dataviz #tidyverse #MoMAColors

0
2
24
Day 19 of the #30DayMapChallenge - 5 Minute Map. Might have gone over by a minute or two 👀 A map of my neighborhood – Harlem! A Frankenstein of code from previous days. Code: Full Image: #rstats #dataviz #tidyverse

0
3
14


Day 18 of the #30DayMapChallenge - Atmosphere. Maps shows the concentration of PM2.5 in the different boroughs of NYC. Code: . Full Image: . #rstats #dataviz #tidyverse


1
8
58
Day 17 of the #30DayMapChallenge - Flow. Map shows difference in number of pick-ups and drop-offs of yellow taxis in Manhattan. Code: Full Image: #rstats #dataviz #tidyverse

1
3
74