

Benson Sun
@BensonTWN
Followers
65K
Following
2K
Media
340
Statuses
2K
Founder of @coinkarma_ Posts may be biased
Joined January 2019
ETH 三重共振信號,進場後24小時內止盈,感謝鮑哥賞臉


回顧上週的貼文, $ETH 在 $4,065 時,流動性指標再出現了三重共振,成功捕捉此次 +14.31% 的漲幅 🚀 想掌握即時的交易機會?加入 14 天免費試用 👉 https://t.co/IRIFqUoha9

3
0
22
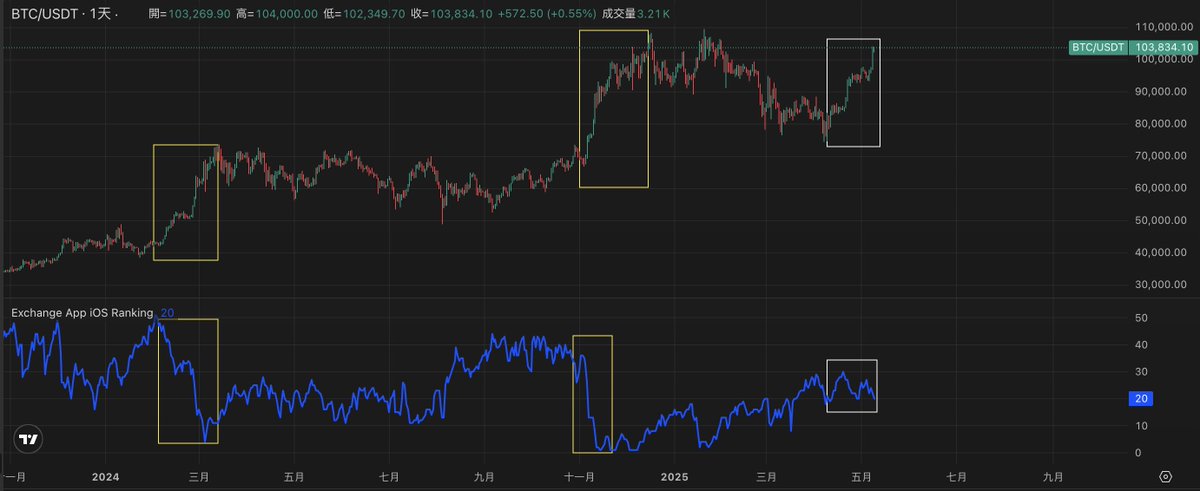
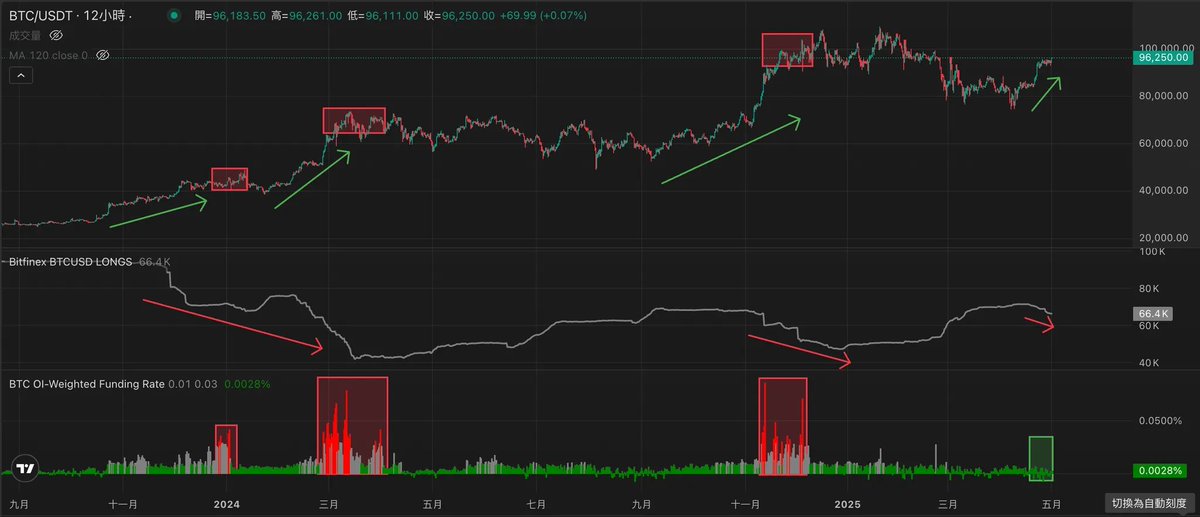
Coinbase APP 排行都還沒進到前十,大餅就突破 ATH 了 黃色框框是 2024年初跟年末的主升段,這次明顯散戶不在車上,交易所排行都還沒熱起來

美元信用危機對 BTC 來說是機會也是風險,現在看起來「機會」的成分大一點,原本判斷是會震盪到 Q3,不過主升段的數據特徵都出來了,前幾天也硬著頭皮上車了。 什麼時候該下車,除了看 funding rate, orderbook 賣壓,@coinkarma_ 也有收錄 App ranking。 圖中的藍線是 Coinbase ios app ranking

15
4
65
BTC 突破 95K 以後官推就一直看多到現在,在大週期指標過熱前,拿住現貨
自 5/1 $BTC 突破 $95,000 以來,CoinKarma 分享了多項指標,預示上漲動能可能還沒走完,並在今日 $BTC 創下歷史新高 🎉 關鍵指標ㄧ覽(詳見留言區 👇) - Bitfinex 巨鯨倉位 - 資金��率 - Market Pulse - Karma Index 週年慶折扣最後 3 天,把握優惠立即體驗🔥 https://t.co/10BTIpbMfa
6
1
38

江山代有才人出,Alpha 一代傳一代 最近看到華語幣圈也開始關注 Bitfinex 數據,深感欣慰 我是在 2019 年開始接觸 Bitfinex,那時寫了一篇介紹 USD 放貸的文章,當時火到一個不行。可能台灣人特別喜歡穩健生息的方式,那篇文章讓成千上萬的幣圈小白從 Bitfinex 放貸開始走進市場——光是台灣就貢獻了
11
6
113
美元信用危機對 BTC 來說是機會也是風險,現在看起來「機會」的成分大一點,原本判斷是會震盪到 Q3,不過主升段的數據特徵都出來了,前幾天也硬著頭皮上車了。 什麼時候該下車,除了看 funding rate, orderbook 賣壓,@coinkarma_ 也有收錄 App ranking。 圖中的藍線是 Coinbase ios app ranking
5
6
61
隨著 BTC 強勢突破,Ultron Signal 的淨值也 ATH 了。 Ultron 的開單邏輯其實很簡單, 就是隨著 Market Pulse Index 高低去開單而已。 Index 數字越低,多頭倉位越滿,2-3 月有幾次跌破 8萬,信號都是接近滿倉,隨著 Index 數字變高會再慢慢減倉, 年初至今收益率
$BTC 接近重返 10 萬,Ultron Signal 收益再創新高!實盤 300+ 天,報酬率突破 87% 📈 Ultron Signal 是 CoinKarma 會員專屬的交易訊號,基於獨家指標 Market Pulse Index 開發自動化交易策略,目前已實盤運行 364 天,績效持續領先市場: 🔹 操作幣種: $BTC 🔹 投資報酬:87.05% 🔹 交易勝率: 85%

2
0
16
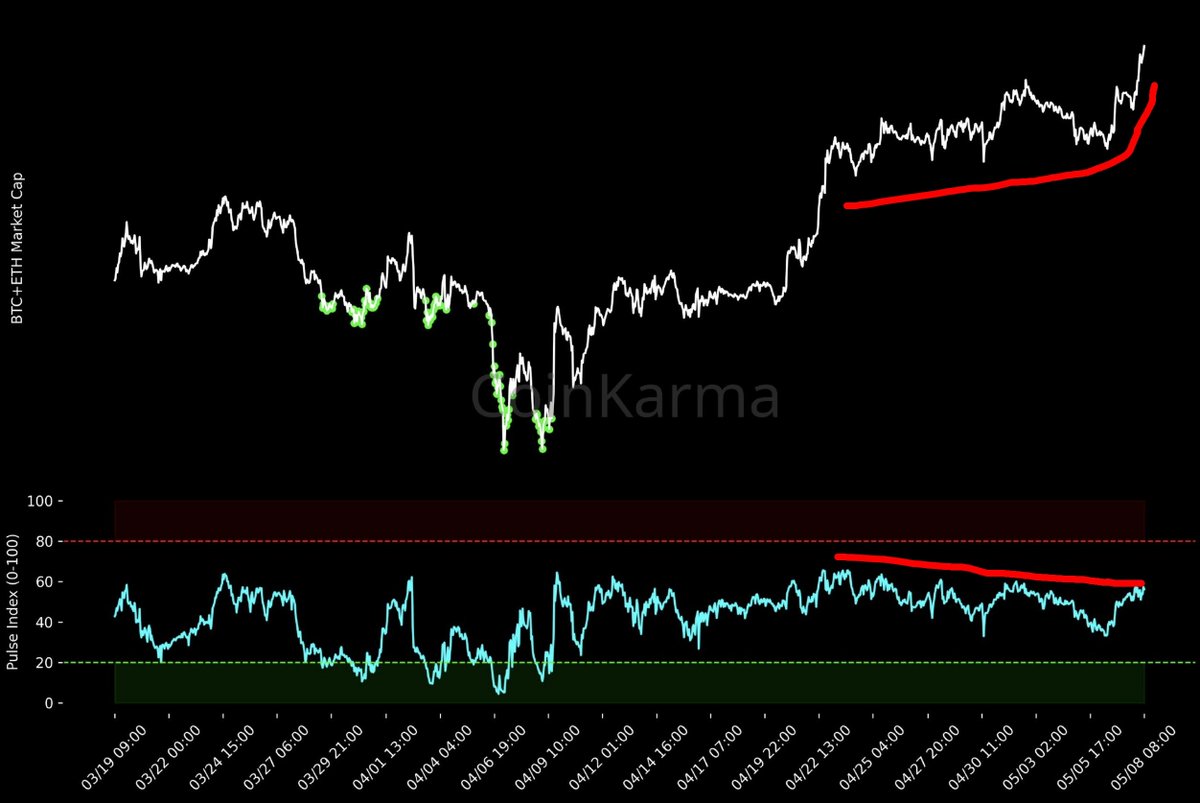
同場加映 Market Pulse Index 的狀況 BTC 價格跑 higher high,但 Market Pulse Index 跑了 lower high,代表整體數據並沒有過熱,市場還是在懷疑中上漲
2
2
33
J 大是 @coinkarma_ 最早的一批種子用戶,從成立以來就一直用到現在了,感謝 @Jclub888 的推薦

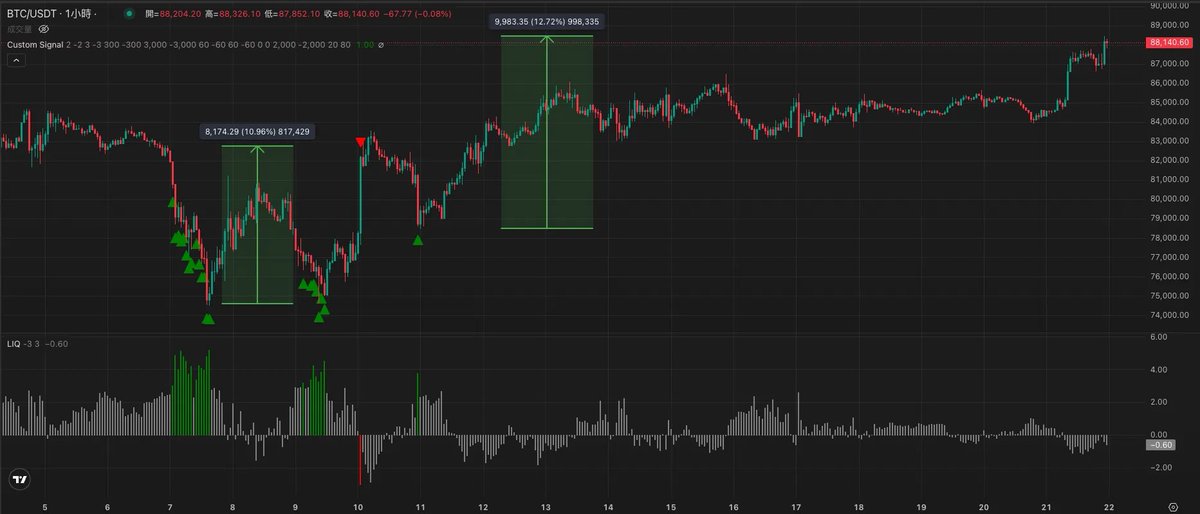
不知道這階段怎麼做單,或者持倉讓人很恐懼的時候看看@coinkarma_ 數據,心裡會踏實多一點。 懂得都懂吧 17年入圈到現在只有這個liq指標讓我覺得很牛逼,勝率大概7成以上,沒有之一。 不帶單也不跟單,只看數據自己做單。 紅賣綠買,怎麼可以這麼簡單? @BensonTWN why tell me why!? $sui


3
1
18
$BTC 重返 97K,Bitfinex 巨鯨倉位與費率揭示:市場或正處於「懷疑中上漲」階段 比特幣近期不斷上漲,Bitfinex 卻巨鯨開始 TWAP(分時委託)減倉,漲勢是不是快要到頭了? 從歷史數據復盤,事實卻恰恰相反——當 Bitfinex 巨鯨開始 TWAP
3
15
66
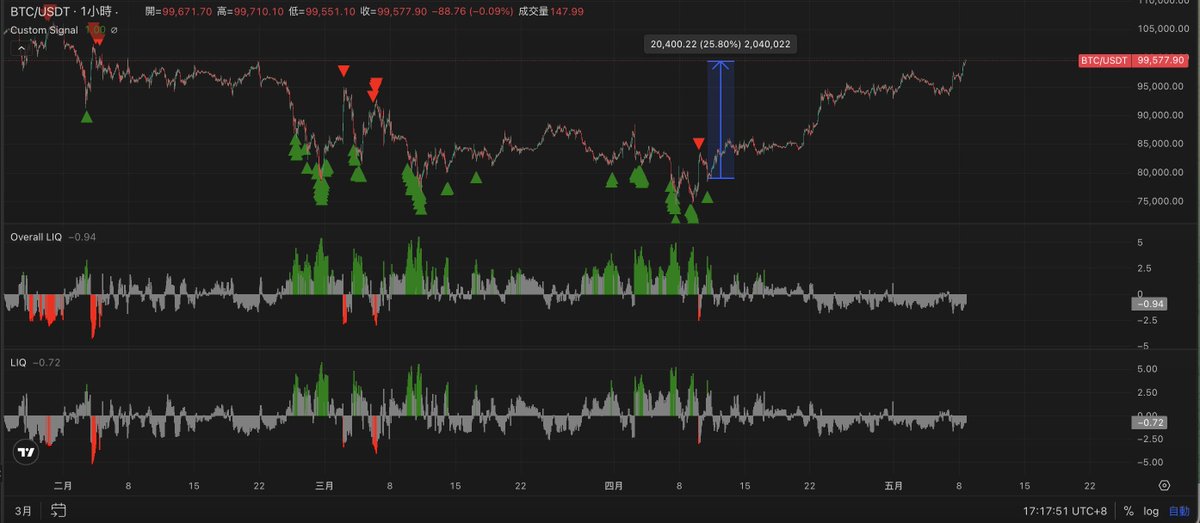
自四月以來, $BTC 流動性指標兩度觸發買入訊號,成功捕捉超過 10% 的波段漲幅。 1️⃣ 首次訊號在 4/7-9,$BTC 價格圍繞在 $76,000 附近震蕩,流動性指標持續給出了買進訊號,並於反彈至 $82,500 左右時觸發了賣出訊號。 2️⃣ 第二次出現在 4/11,當價格回落至 $78,000
2
2
19
1. Binance BTCUSDT 永續合約多空比(LSUR) < 1 2. Bitfinex BTCUSD 相對其他美元交易所出現折價 3. Bitfinex BTC 槓桿多頭倉位減倉 以上數據三件套 如果出現在盤整期,通常是「短線見頂」訊號,市場資金開始保守。
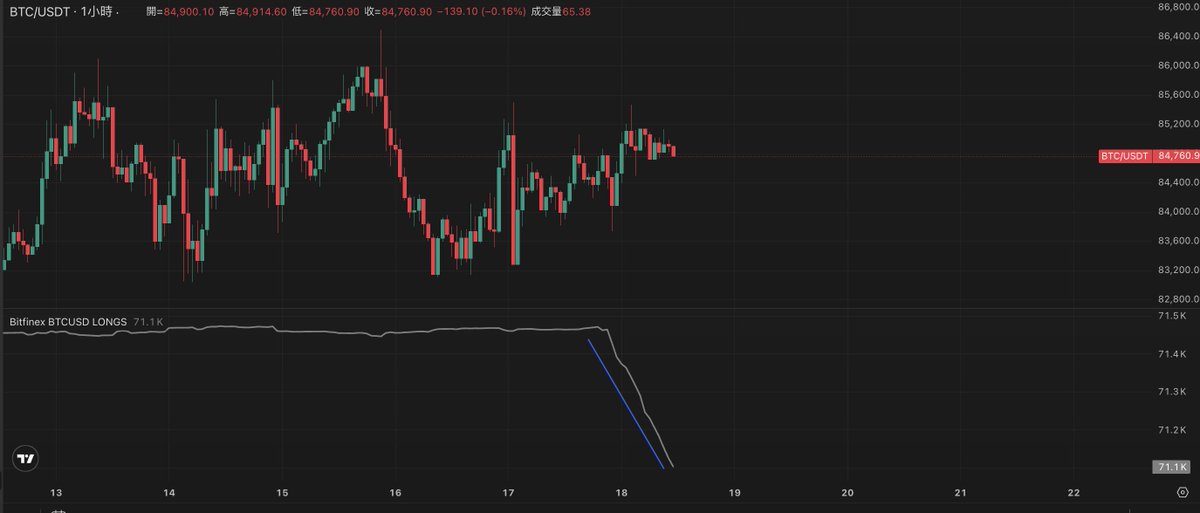
Bitfinex BTC/USD 現在相對 Coinbase BTC/USD 有超過 100的折價,上次出現這個狀況是4/2,上上次是2/4 Bitfinex 上的 BTC 槓桿多頭也正在 TWAP 平倉中 通常 Bitfinex 巨鯨減倉減到折價,都是在主升段買盤流動性很好的狀況下才會這麼出現,現在狀況不太對勁啊

3
5
53
VOXEL 事件暴露了 Bitget 合約做市的風控問題 在本次 VOXEL/USDT 的異常爆量行情中,做市商(MM)持續虧損,但 Bitget 系統卻沒有觸發 ADL(Auto-Deleveraging,自動減倉機制)。 正常情況下,ADL 應該如何運作? 在永續合約市場,如果出現極端單邊行情,導致單邊爆倉且對手盤不足,平台應立即啟動
11
6
83
Bitfinex BTC/USD 現在相對 Coinbase BTC/USD 有超過 100的折價,上次出現這個狀況是4/2,上上次是2/4 Bitfinex 上的 BTC 槓桿多頭也正在 TWAP 平倉中 通常 Bitfinex 巨鯨減倉減到折價,都是在主升段買盤流動性很好的狀況下才會這麼出現,現在狀況不太對勁啊
15
18
135

昨晚 85K-86K USDC/USDT premium 於 4/2 以來首度轉負,隨後修正到 83K
USDC/USDT Premium 折價,指引 $BTC 多次階段性觸頂反轉 當市場進入存量博弈階段,關注資金的輪動與流動性,可以協助我們在行情判斷上有更多發現。透過 CoinKarma 收錄的「USDC/USDT Premium」指標,從圖中我們觀察到: 🔴 轉負折價:今年以來,當 USDC 相較 USDT 折價,都是短期行情觸頂的警訊。

2
0
23
一直以來都反對那種「純庄論」的陰謀論思維。 很多人賠錢第一時間不是檢討自己,而是開始幻想:「一定有一隻看不見的大手專門盯著我開單」、「市場都是被幾個黑手聯合操控的」。 世界怎麼走,是無數因素交織出來的結果。把所有輸贏簡化成「有沒有人在搞我」,只會讓你錯過真正該學習的東西。

@cz_binance 这个世界上就是有些愚昧的人相信: - 世界是被一个幕后大手给操控的 - 任何格外成功的人的背后都是得到了什么神秘力量的帮助或者是被什么神秘力量chosen了或者是成了什么神秘黑手的代理人 - 光明会共济会联合索罗斯美联储马斯克特朗普一起操纵市场收割韭菜 这就和人类历史上出现的一些宗教一样:
1
3
33
說的在理,其實不只賺錢,省錢也是一樣。 舉個例子,有個台灣富豪(曾是台灣首富,身家 1000 億台幣以上,兩岸三地都很知名)幫孫子請家教陪讀,陪讀老師開一小時 $1200,原以為富豪會一口氣答應,結果他砍了 $200,最後成交價碼是一小時 $1000。 你可能會覺得,他幾千億身價,才 200

我说的小钱大钱都要赚,不是说只赚小钱,两回事 事实上,如果时机对,到A8不过是开一个盘子的事情,就像最顺风的18-20年 小钱更多是维持现金流,增加自身的鲁棒性,也就是现在每个vc和交易所假装自己在乎的东西
1
1
32

