@oliverwkim
Oliver Kim
2 months
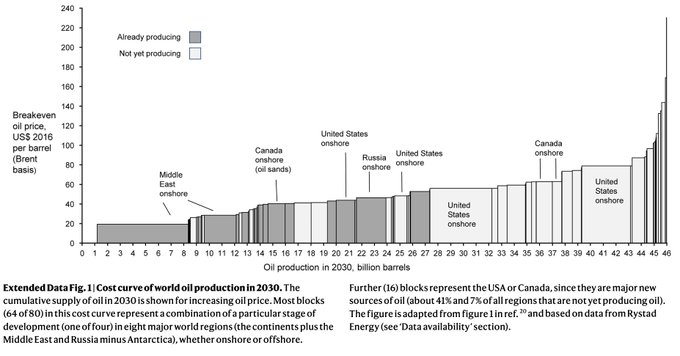
Cost curve of world oil production, 2030. From a pure data graphics standpoint, a remarkable amount of information about the world condensed in a single chart. - from Erickson et al (2020) in Nature: Matters Arising.
Tweet media one
6
27
102

Replies

@oliverwkim
Oliver Kim
2 months
0
0
1
@azeem
Azeem Azhar
2 months
1
0
0
@oliverwkim
Oliver Kim
2 months
0
0
2
@EconPerez
Econ. Hermes A. Pérez F.
2 months
@oliverwkim Do you have the hole reference please?
1
0
1
@oliverwkim
Oliver Kim
2 months
1
0
1
@CarolinaMttssn
Carolina Mattsson
2 months
@oliverwkim still teaching IR 344? @hbarkey
1
0
0
@migowski
Gabriel Migowski
2 months
@oliverwkim Extremely useful. Is there a detailed tagging of which country each bar is?
0
0
0