Explore tweets tagged as #InformationVisualization

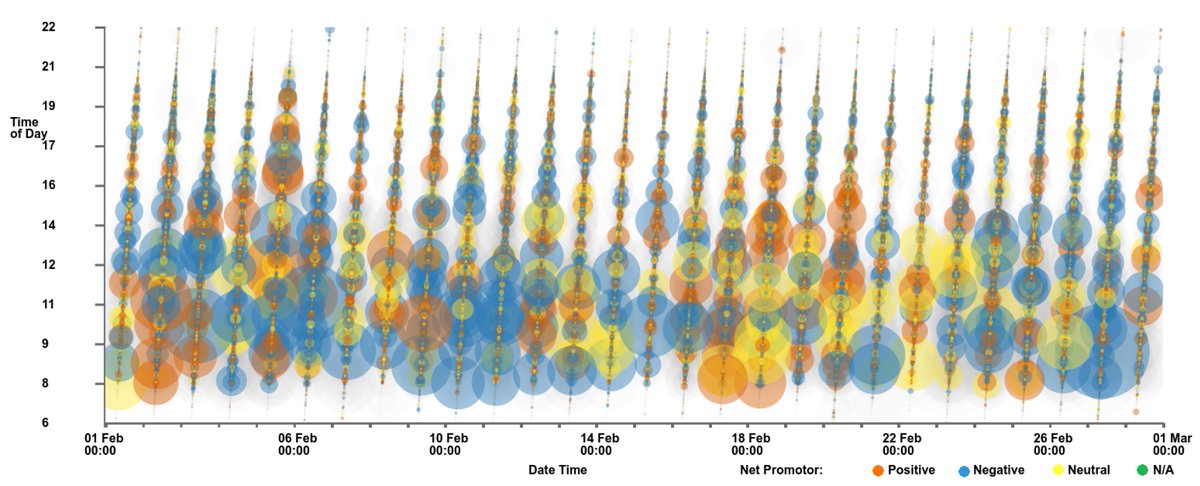
How Can You Provide Your Users with Data So That They’re Not Left Guessing?.#ux #informationvisualization .
0
13
26


Perfect road for data visualization! 🤣.#sankey #informationvisualization #sankeychart .#bangalore #bengaluru

0
0
4
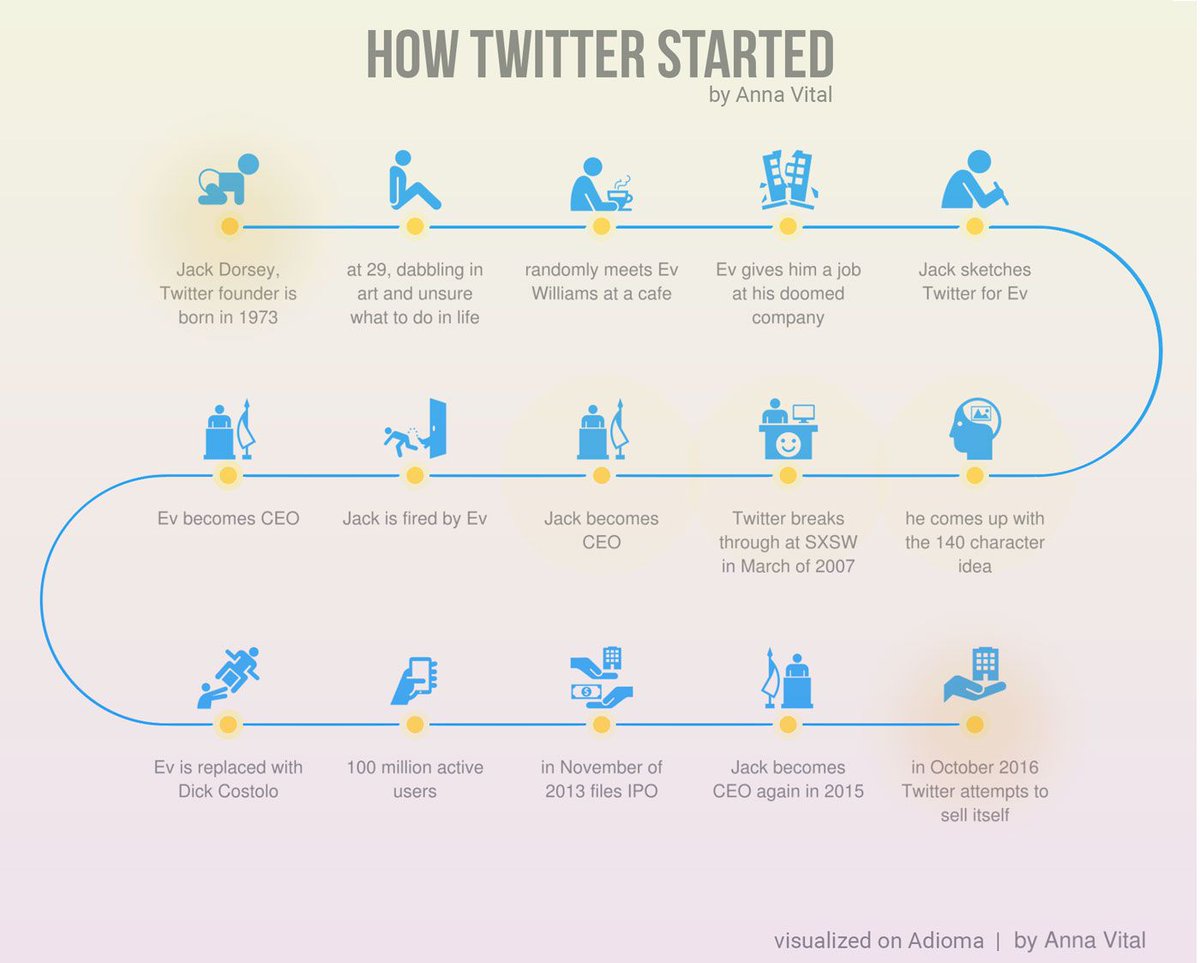
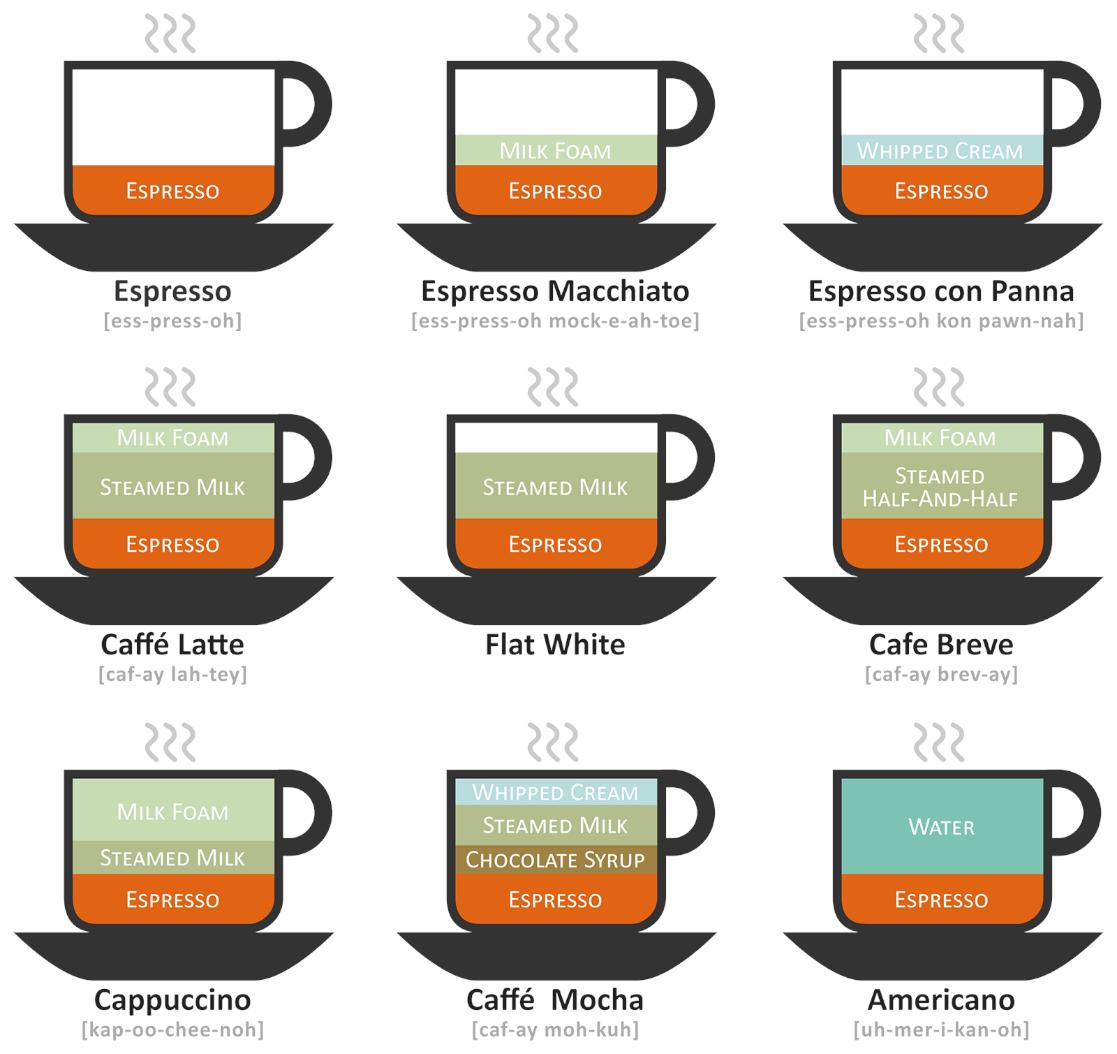
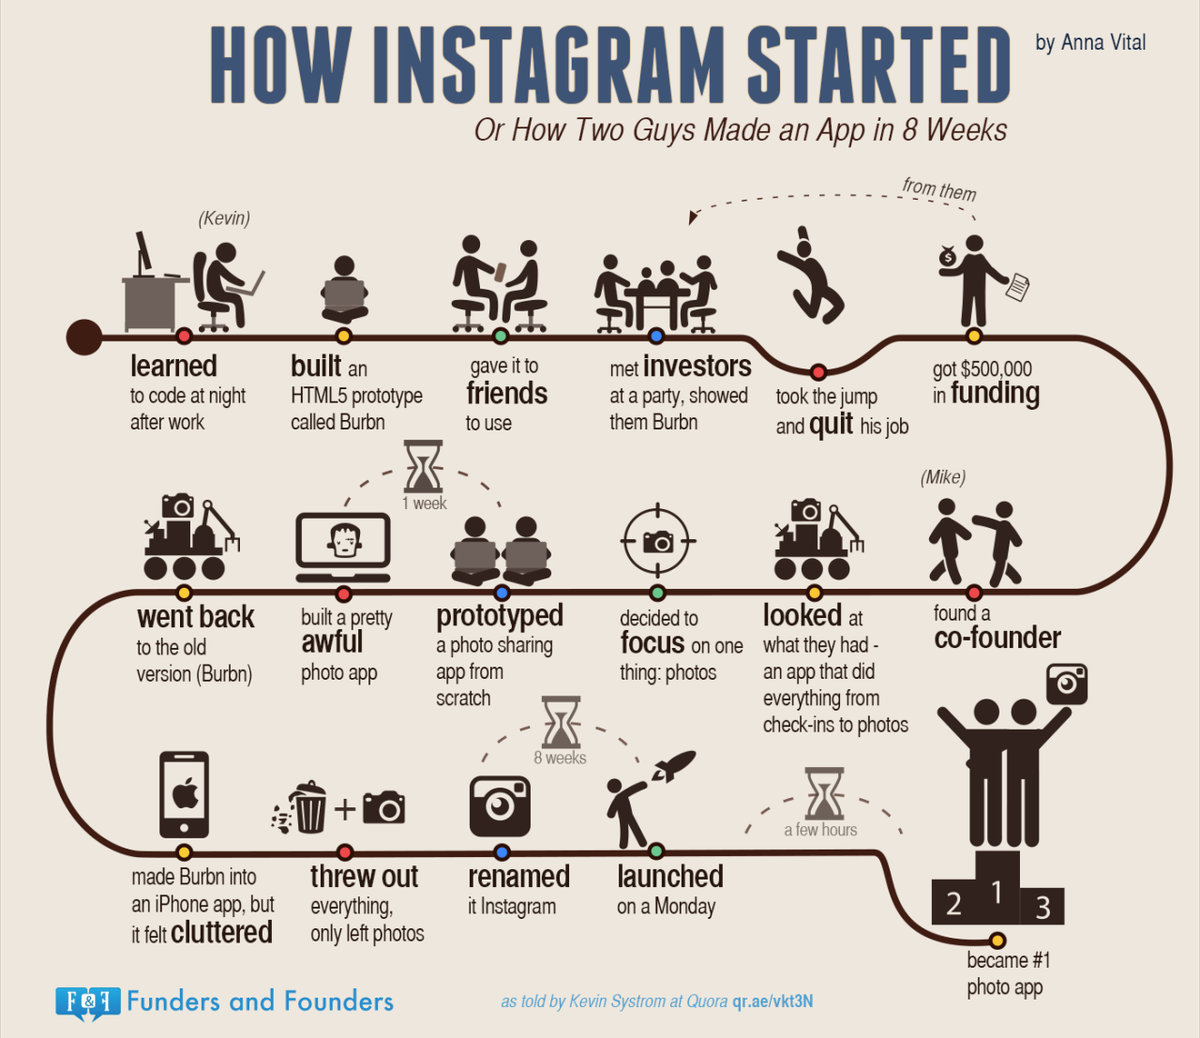
5 Steps Towards Creating Insightful Data Visualizations.#ux #informationvisualization .Photo: @FundersFounders.
0
11
28

So impressed with our #MICA graduate students for their incredible thesis presentations in #BusinessofArtandDesign and #InformationVisualization.


0
1
3

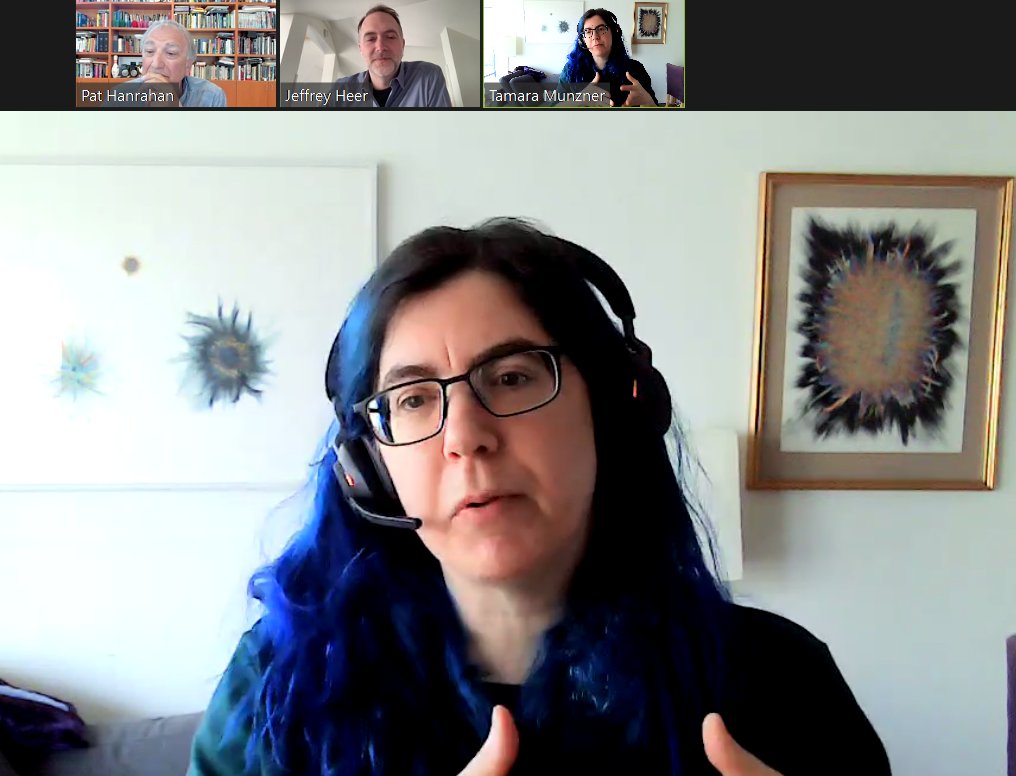
Tamara Munzner, Pat Hanrahan, and Jeff Heer in today's fireside chat-style #ACMTechTalk panel, "Visual Data Analysis: Why? When? How?". Great tips on tools & ways of thinking about DataViz from 3 of the biggest names in the field. #DataVisualization #InformationVisualization
1
4
6


#mdpicomputers Feature-Rich, #GPU-Assisted Scatterplots for Millions of Call Events by Dylan Rees from @SwanseaUni #InformationVisualization #Information # Visualization #BigData #DataScience #hardwareacceleration #CPU #ComputerGraphics #VisualComputing
0
0
2

I've been doing some research on the representation of sensor values on a circle, very common in speedometers and other gauges. Here are some of the ones I liked the most from my studies:. #datavisualization #informationvisualization #designer #design . #1 Vespa

1
0
4
#mdpicomputers IVAN: An Interactive Herlofson’s Nomogram #Visualizer for Local #WeatherForecast by Giuseppe Santucci from @SapienzaRoma #informationvisualization #visualization #dataming

0
0
2

John #Venn—Creator of the ubiquitous Venn #Diagram, born 8-4-1834. #InformationVisualization | ✏️ Michael McNeive (@MMcNeive) » #InformationDesign #InfoDesign

0
0
1

I kind of really love this best #piechart ever—looks like an #informationVisualization but hey, yeah, no, it’s just a picture. That, and because #pyramids. No idea where it came from, or I’d credit a source. And nope, not #infoviz or #infovis; nothing to see here, move along. 😊

0
0
7
This week, learn more about how you can present #data in a relevant and meaningful manner through proper #InformationVisualization. ⠀.Learn more by accessing the free articles on our literature page:
0
2
11
A designer needs to think carefully about the way they intend to represent their data. Here are the 3 elements of visual mapping that you need to know for your #InformationVisualization #designs. Photo by William Iven

0
2
9
Learn about the three elements of visual mapping for #informationvisualization. That way, you can give the data you're translating more meaning to the one reading and using it. #datascience. Photo by Julian Hrankov | Art Machine

0
7
12
If you're tasked with #designing data and #informationvisualization, here are 5 steps you need to consider. #uxdesign . Photo by Bureau Oberhaeuser

1
2
7

Recently published in Information Visualization (#IVI):.Topology-aware space distortion for structured visualization spaces.Weihang Wang, Sriram Karthik Badam, Niklas Elmqvist.Apr 2022 - 21(2).First published: 25 Oct 2021.#informationvisualization

0
1
10

How can I make information visualization accessible? Watch the video to learn from @LinkedScience from @AaltoOLE. #informationvisualization #visualization
0
1
6

Am 21.11.18 um 17:15 h @FHPotsdam (Haus 2, Raum 014) diskutiert @nrchtct im Potsdamer Informationswissenschaftlichen Kolloquium, ob es sich bei der Visualisierung kultureller Sammlungen bloß um eine Augenweide oder auch um ein Analysewerkzeug handelt. #InformationVisualization

0
2
6