

Cameron Riddell
@RiddleMeCam
Followers
766
Following
774
Media
88
Statuses
425
scientific computing, data science, Python enthusiast, instructor @dutc_training
Sacramento, CA
Joined December 2021
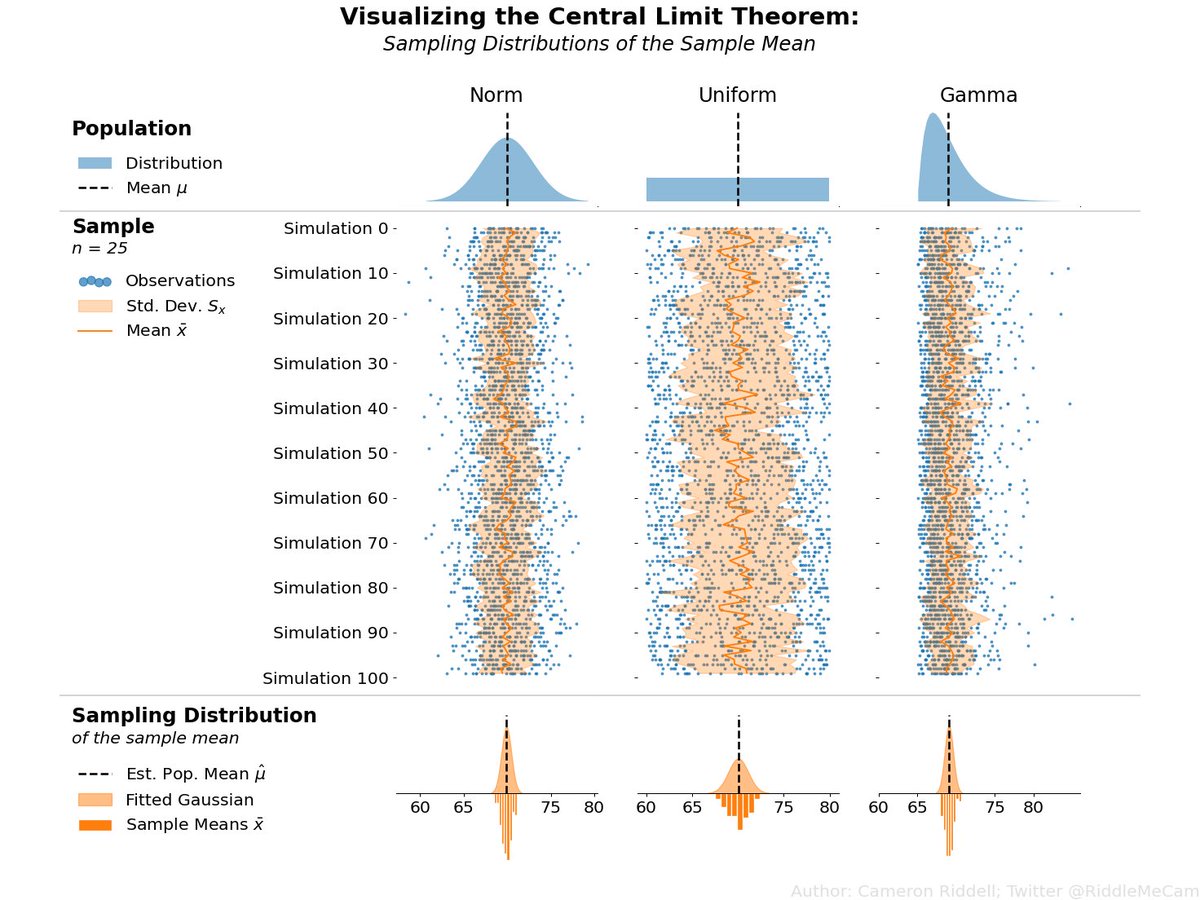
Been working on some visualizations in @matplotlib to highlight statistical concepts. This one intends to demonstrate (via simulation) the Central Limit Theorem: the sampling distribution of the mean is gaussian if given a large enough sample size regardless* of the population.
26
173
1K
@theAGU Of course everything you saw here was made entirely in @matplotlib - thanks for the SubFigures to help layout this "poster"!.
0
0
1
@theAGU When presenting data, it’s key to guide your audience through a chart as you would with text! In this viz, I enhance a basic heatmap and add features that guide attention towards specific perspectives to support a narrative!. Code + more:
1
0
1
Recently held a dataviz session for @theAGU, part of their annual data viz competition for students The viz were great, but they often lacked focus for an audience to quickly understand what was going on. (link below for the code & discussion)

1
2
11

My favorite, funniest looking import I use since I keep replacing things I used to do in @pandas_dev with @DataPolars for data processing. That said, @pandas_dev is still an incredibly flexible tool with many diverse/useful functions making it a true data swiss-army knife.
0
0
2
RT @Sac_Py: @RiddleMeCam gave a great talk on Data Visualization in @matplotlib from the #CognitiveScience perspective. .
0
1
0
@pandas_dev @DataPolars If you liked this thread, then take a more in-depth look at my blog post on this topic: where show these patterns in DuckDB and recreate them in both Polars and pandas.
0
0
4
@pandas_dev @DataPolars Convenience: Finally let’s insert these into a more ergonomic API, we can use its registration mechanism to implement something that builds upon the existing style of Polars and is relatively self-contained.

1
0
2
@pandas_dev @DataPolars Cube: Let’s reach into `itertools` for combinatoric group generation, since we’re comfortable with Python we can make effective use of both itertools and generators to recreate the group by cube feature in SQL!

1
0
1
@pandas_dev @DataPolars Roll up: What we now have here is a generalized approach to query a DataFrame with different grouping sets. So now we don’t need to worry about the data at all- instead we can shift our attention to the creation of the groupings, effectively decouples the two functions.

1
0
0
@pandas_dev @DataPolars Grouping sets: It turns out this feature isn’t tricky to implement, all we need to do is iterate over some existing groupings, evaluate them in the correct context, and concatenate them back together.

1
0
0
Why do I always say you need good Python skills to make the most of your @pandas_dev and @DataPolars data tools?. Let's take a convenient SQL feature as an example: groupby sets, rollup, and cube. These aren't implemented these Python DataFrame libraries.

1
1
6
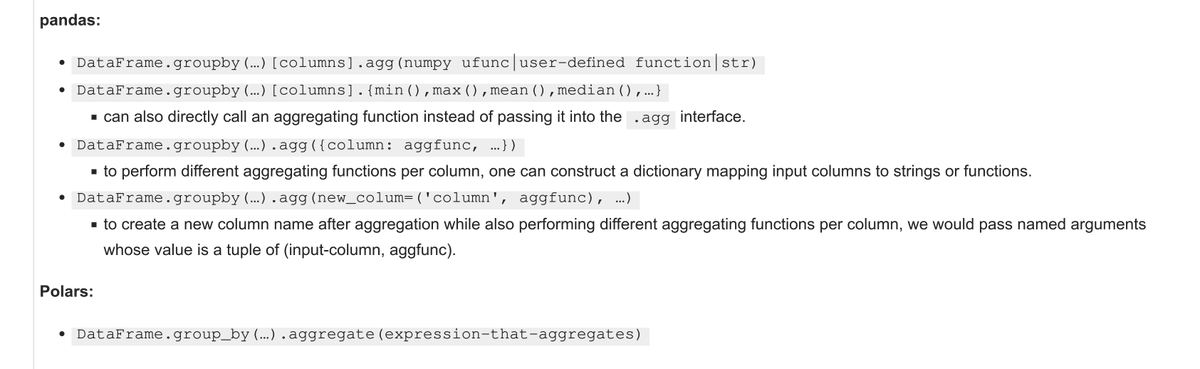
I love using both @pandas_dev and @DataPolars, but I will say that in terms of a consistent API, @DataPolars `group_by` context + expressions really takes the cake. See the rest of this comparison for group & window functions on my most recent blog post:
0
0
4
RT @matplotlib: Hey folks, can you do us a favor? If you're doing (or know about) NASA funded work using us, can you let us know? Thanks!.
0
45
0
There are many ways one can provide intentionality in data visualization, the important thing is to begin thinking critically about what you want to visualize and how you can support that goal. Check out recent blog post for more on this topic.
0
0
0
By removing some (colorful) noise from our visualization, we can supplement information through that same channel, such as highlighting the maximum value within each month without re-introducing visual competition.
1
0
0
Lets show the same data using intentionality to facilitate the within month comparisons. The within month comparisons are MUCH easier to make since we no longer rely on the legend and have less visually competing colors.

1
0
1
On a closer look, you’ll note that it is easier to perform a comparisons within each cluster (month) along the x-axis. The across month comparisons are present, but visually hard to perform.
1
0
0
Take this clustered barchart for example. While it shows the data, it does not have intentionality (what comparisons am I facilitating, and why).

1
0
1
Exploratory data visualization is much more than just "putting data on the screen." When you visualize data you facilitate the obvious comparisons, and it is important to be intentional with what is obvious. 🧵.


2
1
15