
My team has been doing some perf work the past week or so and I'm going to share some pretty graphs! Because everyone loves pretty graphs. Except our execs who like up and to the right, so don't tell them.
Here's
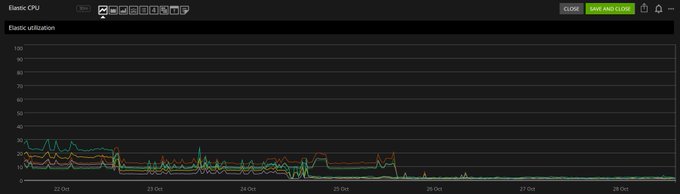
@deanward81
optimizing Teams Elastic. The CPU has dropped to 1-2%:
1
7
96
Replies
@deanward81
It hasn't *completely* eliminated search query times but most spikes are done and average search duration is down at ~20-40ms. I'll take it.

1
0
5
@deanward81
With
@marcgravell
: by only looking at question changes on sites that had activity since the last refresh, we can also greatly reduce the amount of loading our tag engine does for deltas. Forgive the reporting issues we solved, but overall: 40 seconds down to ~200ms to load now:

1
0
11
@deanward81
@marcgravell
I did badge grants (again only for active sites) last week as well as tuning super rare badges to run more rarely. This dropped the badge grant time per hour down from 27min to ~6 min. More optimizations are in queue (deploying in a moment):


2
1
6
@deanward81
@marcgravell
The core mechanism for this is simple: a Redis hash of site IDs and last activity time. When looping over anything that needs to run for N sites, we can grab (in 1 command) that hash, and see if it has activity recently enough to matter. It's super simple, but very effective.
1
0
9
@deanward81
@marcgravell
This is the one I'm working on next: concurrent SQL connections. It's a sliding-scaling issue of sockets (e.g. TIME_WAIT), pooling, and hard open/close performance trade-offs. The deploy underway should help this a lot - I'll try to remember to post an update later :)

1
0
8
@deanward81
@marcgravell
Some success! I killed off the top offenders but still need to do another pass tomorrow to see what the remaining trouble makers are:

1
0
7