Geoffrey Fouvry
@GraphFinancials
Followers
6,175
Following
165
Media
2,816
Statuses
25,158
Connect the Financial dots Docs, Imgs, texts, Vids linked by big-data Present, reply in augmented media US Patent approved. ex hedgie 👇 get your free account
New York - Rio de Janeiro
Joined August 2015
Don't wanna be here?
Send us removal request.
Explore trending content on Musk Viewer
Barca
• 513138 Tweets
Barcelona
• 485601 Tweets
Champions
• 407221 Tweets
Mbappe
• 300731 Tweets
Dembele
• 271425 Tweets
Araujo
• 263314 Tweets
Dortmund
• 180862 Tweets
WNBA
• 178126 Tweets
Xavi
• 170866 Tweets
برشلونة
• 108062 Tweets
Glauber
• 104987 Tweets
Lebron
• 72790 Tweets
Lakers
• 68260 Tweets
FERNANDA FEZ HISTORIA
• 57989 Tweets
Harlem
• 52412 Tweets
Racing
• 44509 Tweets
MORTO
• 39059 Tweets
Zion
• 29473 Tweets
#TierraDeNadie6
• 27275 Tweets
Pelicans
• 26180 Tweets
#BARPSG
• 25708 Tweets
FUERZAS FURIA
• 23776 Tweets
meredith
• 23137 Tweets
Medina
• 23008 Tweets
Rio de Janeiro
• 20378 Tweets
Cavani
• 20291 Tweets
チキンタツタ
• 18406 Tweets
Anthony Davis
• 15836 Tweets
#TTPDTimetable
• 15553 Tweets
#WWENXT
• 15154 Tweets
Godoy Cruz
• 14824 Tweets
Pels
• 10647 Tweets
tiago
• 10591 Tweets
Last Seen Profiles
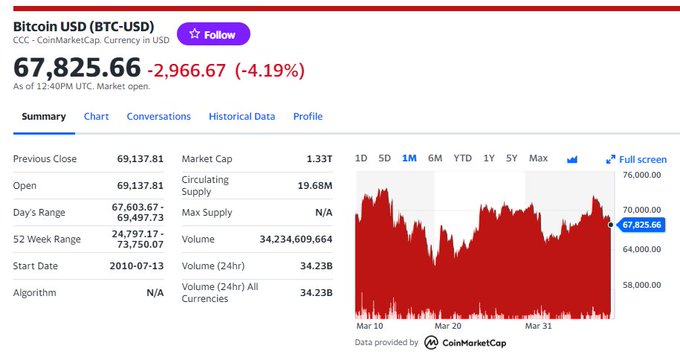
So CPI Hot and
#BTC
? Hedge for what exactly?
The most stupid "asset" EVER. beats tulips 🙄
549
37
436
@OCanonist
D'Artagnan was written by Alexandre Dumas whose father was general Dumas whose name is on Arc de Triomphe for his incredible service notably for his accomplishment in holding a bridge against Austria. General Dumas was creole. Education is a good, it can prevent stupid remarks
51
12
179
Something is about to break.
6% is absolute pure LUNACY.🤕
On the most central asset on the planet.
China
#gold
The SGE 9999 premium has widened out even further overnight and is now above 6%.
I've never seen moves like this and I've been tracking the Shanghai Gold Exchange since it started...
75
339
1K
16
45
157
@michaelxpettis
Michael is right. For 50 years America has been oppressed by the BRICS and forced to pay its deficit in USD, while actually all the US wanted to do was to pay in Gold. This oppression must not stand, free the US Gold for payment of the trade imbalances. Michael =freedom fighter!
6
12
121
@Sorenthek
An asset that is not a liability so that it enables to avoid double counting reserves, and hence enables wealth transfer by transfering purchasing power instead of double counting it, enables PPP gap shrinkage via Gold arbitrage, & ends the vendor financing of the RoW to the US.
4
10
93
1/2 🧵
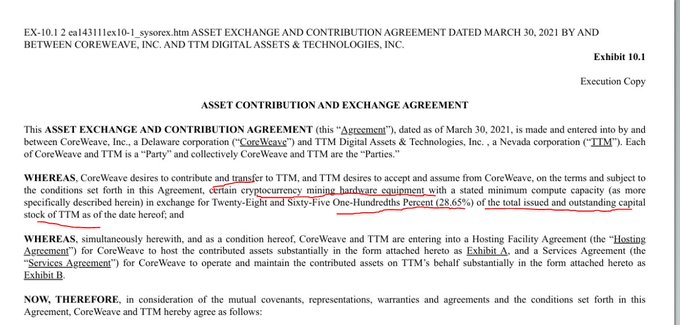
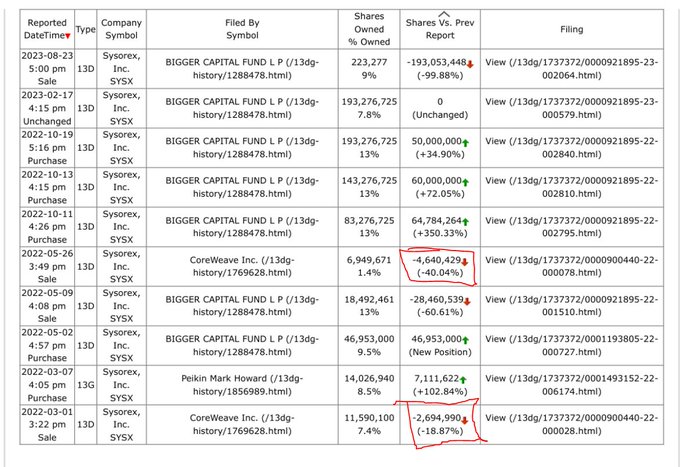
#Coreweave
has a history of dumping GPU at a loss to the investing public by contributing GPUs to TTM co, then reversed merged into Sysorex. Then dumping shares of Sysorex (crypto mining Etherum)
WATCH 📺 the Graph recording In Augmented Media
👉
3
19
72
@Kathleen_Tyson_
@YouTube
It's not only possible, reserve ccy foreign FX in a central abnk is actually the problem. "Reserve currency" was invented by the League of Nations in 1922 (resolution 9). It's inflationary, it's seigniorage. Local ccy swaps + balance in Gold gets rid of parasitic "reserve ccy"
2
23
72
1/25 🧵
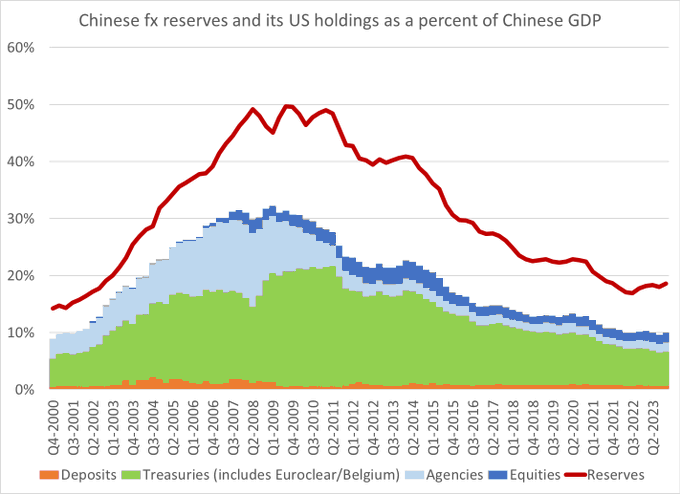
How to Rug pull a system of “reserve ccy” in history? Not so complex;
it happened twice.
The 3rd is happening rn, (a smoother one)
How
In 1927 Rist from Bank of France is in NY with Strong and Montagu Norman and tells: "Enough FX as reserves, send me my
#Gold
". Game over
7
19
73
$NVDA The "bridge financing" might go sour if the CW IPO fails. GPUs don't qualify AT ALL as long term collateral imo.
The whole idea was fast IPO & change the capital structure.
When China pricked the miners bubble (04/2021), Coreweave moved from pump to dump on GPUs like 🫰
8
12
67
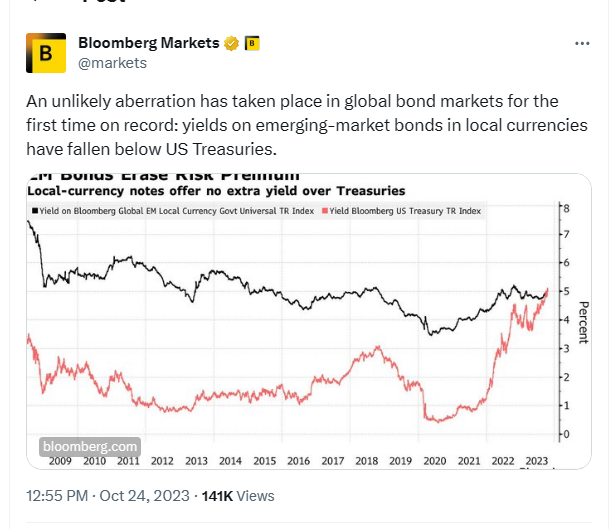
We are a 4.42%... on UST, we'll get to 6%.
Countless attempts by Gov to manipulate prices in 300 yrs of archives. It always fails eventually.
Don't despair, it will implode nicely. 😊
Good day to you
@BogachanOz12426
6
10
66
@OptionsMir
@JerrBearr
To avoid an undisclosed related party transaction, IR should have made sure that the NVDA ownership in Coreweave was disclosed on the call. When it's omitted in the financial statements themselves it can lead to SEC charges
@Citrini7
@SamanthaLaDuc
6
11
65
The shortening of maturity is indeed another sign of fiscal dominance.
8
11
58
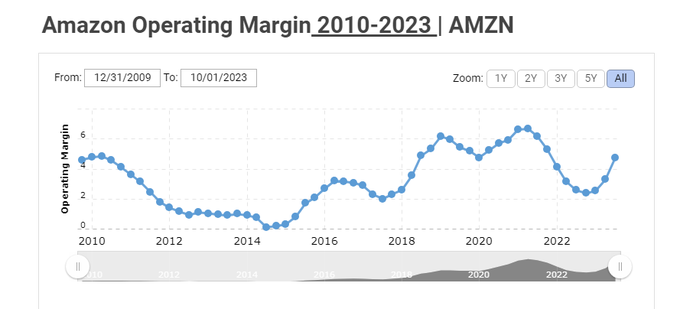
$AMZN Yep,
They almost managed to match the the operating income of 2 years ago same quarter.
Q2 2023 EBIT
7.68 Bi
Q2 2021 EBIT
7.702 Bi
6 Mo ended June 2023
EBIT 12.4 Bi
6 Mo ended June 2021
EBIT 16.5 Bi.
Nominal, don't even think about adjusting to inflation.
Growth 🙃
11
6
56
@NGLFundamentals
The social contract before 2008 was this:
You can get really rich in America, but if you fail you fail, your problem. And then the social contract was broken.
2
5
54
@LukeGromen
Exactly, and people would be surprised how much the US manuf would benefit. The biggest growth of the US was during 1866-1913, no central bank, no reserve currency, no large gov spending, prices falling ( & I am not even an "Austrian" )
The artifice dates back from 1922.
5
7
51
1/9
Let's look at that one.
Say Ganha has USD IMF debt, exports
#Gold
&
#Cocoa
to China. Today they need USD to repay the IMF so they sell those commos in China in USD. China needs USD to buys those commos, so they undevalue their labor to export to the US and get USD.
4
9
48
@LukeGromen
They don't really need to.
In fiscal dominance:
higher rates mean higher inflation & lower ccy.
To wit:
10/01/2022 (1st duration shock)
- Rates peaked 50 bps LOWER
- YET Gold today is 10% higher
- Yet DXY 5 pts WEAKER
Gibson paradox / Thomas Tooke always works
Ask Argentina.
6
3
46
$AMZN decided in 2022 that its computers were more durable, hence taking less depreciation charge.
TADA!
A gain on EBIT of 2.8 Bi.
Accounting can be quite creative.
@ecommerceshares
@concodanomics
That means that compared to 2021 Q2 EBIT is down 10% nominal this quarter.
5
6
44
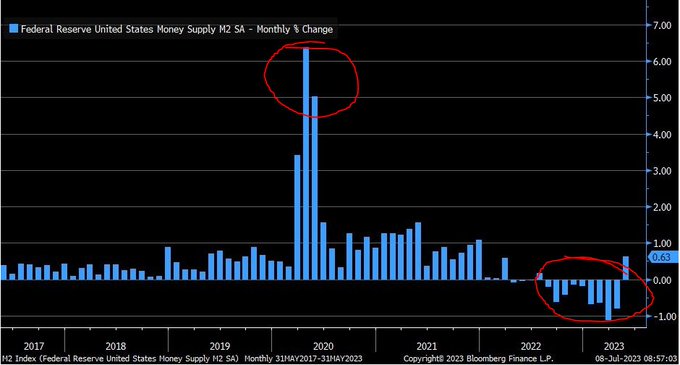
1/7 Few thoughts about the expansion of M0 that is not QE but seems like it could turn into it.
The
#Fed
has turned the spigots on BTFP. At first it looks like your traditional lender of last resort thing and backstop of credit.
1
13
42
PROBLEM OF DISCLOSE AT NVIDIA:
1/3 related party transaction
Since Coreweave is responsible for the beat 17% of sales so fast, & since NVDA is backing it, the NVDA IR should have put a lot of care in disclosure. Now it looks like an undisclosed related party transaction.
There's something very suspicious about Nvidia's earnings and their big client nobody's ever heard of: Coreweave.🧐 Thank you to
@SamanthaLaDuc
for taking the time to talk about it! $NVDA
#AI
#Coreweave
95
175
788
8
18
43
@KingKong9888
@ThomasFontaine1
Pricing
#Gold
in 2 ccy does a massive change
1 ccy
If the PBOC sell USD for
#Gold
it would only push Gold vs USD, no CNH/USD impact
2 ccy
W/ physical Gold in Yuan,
#Gold
becomes the Kingpin again to force trade to matter again in FX via Arb. Short USD,buy Gold, Sell Gold Buy Yuan
6
8
42
@Sorenthek
Gold is most important of all commos, it is the one you use for the Christening of your child if you are Catholic, for a wedding ring, for a precious gift in many cultures or for ceremonies. Those who do not understand are nihilist nerds out of touch w/ the world they live in.
4
0
41
1/20 🧵
#Bitcoin
is is more like fiat than
#Gold
. It is like
#Fiat
“nothingness” but without the State to enforce its use. And the scarcity argument is 100% misguided. Before you dismiss me as a Tech hater my little co has a US algo patent approved.
@nntaleb
@LynAldenContact
9
6
39
@farmersteveg
@Kathleen_Tyson_
@michaelxpettis
Me? No. I have the highest respect for the institutions (council of foreign relations) receiving money from defense contractors.
@marcuschown
@BBCNews
Here’s a handy list of which think tanks and lobbyists are on the defence industry payroll:
2
19
45
1
4
40
Wow, 5,000 followers. Thanks to each and every one of you, especially
@SamanthaLaDuc
,
@ces921
I have the opportunity to work with,
@LukeGromen
with whom we shared professors at Weatherhead in Ohio,
@KingKong9888
for the 1-2 punches deriding financial absurdum
4
1
38
@Kanthan2030
@Kathleen_Tyson_
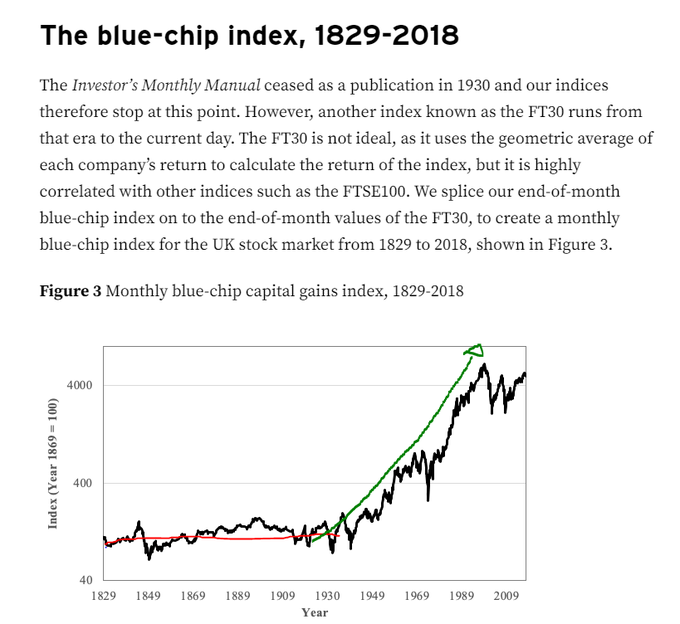
In mid XIXth century you had 4 monetary standards and it was more stable than today..... The idea that you need absolutely only 1 standard is not verified by long history.
0
4
37
1/3 In the beginning, there was Satoshi Nakamoto,
he was sitting in the monetary desolation....
On the first day he wrote the white paper, and the white paper became electronic flesh
#Bitcoin
16
14
47
@AndreasSteno
It NEITHER of the two. If you know you classics about commodities, you would know that during embargo fear ppl create a bubble with backwardation, and then when the fear is released, speculative positions puke. This has been true since embargo on Sugar during Napoleonic wars.
2
3
35
@Kathleen_Tyson_
@SamanthaLaDuc
@LukeGromen
@SantiagoAuFund
@izakaminska
@wmiddelkoop
@marcmakingsense
On September 22nd, the sale of
#TSY
of 19.2 bi was not not coordinated with Yellen. Kodo news . At the same time that Japan was wacking the MOMO yield pigs, the
#TSY
yields gapped up massively. SAME EXACT time. Gilts were trading inside and blew up.
2
7
37
@realdeepakterra
@historyinmemes
It is absolutely not about the gov, since the gov was oppressive and collaborating while the villagers disobeyed !!! 😇
0
0
35
#Silver
, you think it's bonkers? You should get 800 years of data. The monetary dominance guys shorting the best electric conductor metal (the stuff you need in an AI data center for electronics) with moderate "spec premium" at 90X GSR ratio yet w/ gigantic fiscal dominance pb🤭
3
4
36
9/10 So why does Mr. Buffet hate
#Gold
?
He pays negative real yield on insurance policies, & buys inflation repricing assets.
It's a permanent wealth transfer of the XXth century to finance WWI/ WWII / colonial wars, Vietnam...
Welcome to the Matrix
@MikeCristo8
@RudyHavenstein
3
6
35
1/8
This thread is interesting but somewhat fails to grasp that EVEN IF the issuance of USTs is not a liquidity event, it can increase the probability of a recession ANYWAY, by other means. 🤯
2
4
35
@LukeGromen
If Russia sells below market, Shale does not cover costs. Rigs count goes down. It's very apparent per Dallas' Fed survey, rigs counts drop and you get a mini-squeeze (right not) or large squeeze at some point
@RealKeithWeiner
3
0
33
The end game of financialization followed by monetization of bad debta, sprinkled with denials about the long term inflationary effects of M0 finally moving from monied capital and getting into the circulation.
#slumpflation
3
7
29
2/2 Ppl forgot that before being used for AI (a better market) the GPUs were used for Crypto-mining. As it soured in 2021 Coreweave dumped GPUs in a 2 step.
Reverse Merger filing, 13-Ds
explained in the augmented media link ☝️ part I
@JG_Nuke
@SamanthaLaDuc
@Citrini7
3
3
31
@SamanthaLaDuc
Yes, I saw Paul Tudor Jones just explaining the same. He has done his sovereign debt/ solvency studies/ homework. It's the bonds market that is delivering the rate hikes, not the
#Fed
.
Same as
"Gov cost of funding transferred to the private sector."
1
9
32
1/4 🧵
Fiscal dominance in Full Display:
This has consequences. Because the the
#Fed
has a negative remittance to the US Gov.
In other words the US Gov is losing on the inflation tax when it sends back interest
to the Banks in RRP.
2
11
28
@ecommerceshares
As Thomas Tooke famously wrote in 1826, do not confuse return in money and return in kind. In other words, get the S&P dollar value in USD and go to the grocery store & see what you can buy with it (return in Kind). The decrease of return in kind of bonds is what makes them sink.
2
1
26
1/3 🧵
As Rueff explained the system invented by resolution 9 of 1922 Genoa convention FX as reserves, disconnected trade from Gold distribution. So the Gold price was benign, some sort of Bitcoin PLUS if you will.
2
12
28
@vtchakarova
Let's stop denying reality: Ukraine should be have split a long time ago. Most pragmatic thing to do. No chance Russian speaking ppl will ever reconcialiate with the Ukrainian speaking ppl and vice & versa. Would have saved lives and treasure. Let's get real.
33
1
23
@elbitcoinamb
@Sorenthek
No,
#BTC
is not an asset, it is a scriptural monetary abstraction like USD, CNH, collective imaginary yardstick, a "Name" to measure things of value (goods & services), not a thing of value itself . The purchasing power depends on monetization (use for goods & services)
10
1
27
@PeterSchiff
No Central Bank who could print ever turned its back on its Gov and have it default in 300 years of financial history. Central Banks always keep their master liquid. But maybe this time is different? So the second option is clearly the most likely.
2
1
25
@SamanthaLaDuc
As soon as the US Gov is fiscally responsible and the trade is balanced, the USD should probably stop falling aginst
#Gold
😊
9
4
26
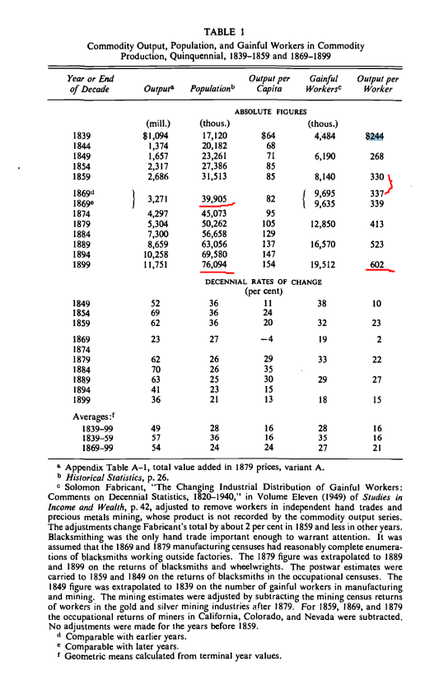
7/10 I can hear already some people scream bloody murder that deflation is a disaster
@hendry_hugh
The disaster:
Output up 4X between 1865 and 1889,
Population almost 2X
Prices? Down 50%
1
2
26
1/20 PM Miners ARE A SPREAD BETWEEN DEVALUATION AND INFLATION
The profitability of a PM miners is the difference between its sales & costs. Thank you Mr. Obvious.
J. Fullarton noted the issue of miners' margins during the UK's fiat episode of 1797-1821.
@KingKong9888
@GaryBohm5
2
6
26
@LukeGromen
It's desperate Luke, they don't connect the dots. I actually think that Putin's plan was to blow up duration as the main objective. With a Fed hell bent on using rates & paying M0 on M0-RRP as policy tools vs of reserve requirements, b/c Banks lobbied not to be starved like Japan
4
0
23
@financialjuice
Pff. Failed to pay interest in 1785...defaulted in 1787. Then went fiat temporarily but restored convertibility in 1870s post civil war. One century later default on Gold obligation (again). Currently in default by installments via the currency.
0
3
25
@jynpang
@Kathleen_Tyson_
Next Step: Washington will have only American Companies and American citizens left to sanction.
0
1
25
@FinanceLancelot
What a misinformed post. There are two sources of liquidity. Interbanking and reserves. Reverse Repo is just M0 sterilized. Have you check the deposit rates? I suggest you watch Richard Koo interview (Mr. Deflation Japan). Right now the biggest risk is sterilization failure.
3
1
22
The
#Silver
gap is so large you don't need the short leg to arbitrage. 🤣 Just bought.
@notanobject
You have 4 parameters on Silver.
- Silver to Gold ratio very high right now at 87
- Silver to Food commo ratio on the cheap again
- Silver miners margin low = USD too high
- Level of fiscal deficit in USD.
Not that hard to know which one is closer to the mid-range price.
1
0
5
3
4
24
@WallStreetSilv
Technically the US is largest debtor nation in world's history. Largest in external debt to GDP ratio... so who is semding money to whom right now...
1
0
21
2/12
f) We get a duration shock that cuffs the
#Fed
otherwise we have more banks' bond pukes into BTFP
We get credit downdgrade and the market asks for more yield
g) The gov officials are in denial making it worse
1
0
23
@AlessioUrban
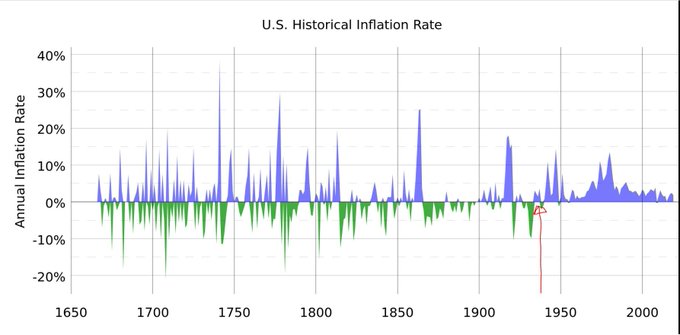
You even have ppl who talk about deflation in the US...🤭
Inflation is just a "number" for markets to justify a low cost of Gov funding.
It is not meant to reflect prices in stores, it's just for show.
Deflation is a fantasy post 1933 (elastic money)
No green spike down after
3
1
20


