
Geography Realm
@Geographyrealm
Followers
53K
Following
5K
Media
172
Statuses
22K
Since the 1960s, blue jays have gradually extended their range past the Rocky Mountains into the western United States and Canada. #geography .
0
0
5
Researchers using models and historical records estimate that up to 11% of all bird species have gone extinct since the Late Pleistocene. #geography .
1
0
9
A study of 135,153 vascular plant species predicts that by 2070, 33-68% of land on Earth will experience significant phytoclimate changes. #geography.
0
3
4
Learn how to create a radial flow map in QGIS to visualize migration using metro-to-metro data from the U.S. Census Bureau. #GIS #qgis #geography.
0
0
3
NatureServe has developed an updated 30-meter hexagon map of regional ecosystems in the contiguous United States and adjacent areas. #GIS #geospatial #geography .
1
0
3
Bubbles created by the movement of waves can influence how much carbon dioxide is absorbed by the ocean. #geography .
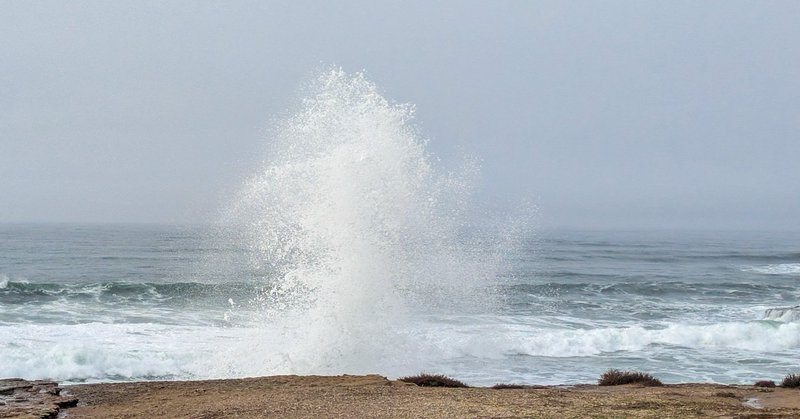
geographyrealm.com
Bubbles created by the movement of waves can influence how much carbon dioxide is absorbed by the ocean.
0
0
3
Groundwater stored over many years is a significant contributor to streamflow in Western United States mountains according to a published study. #geography .
0
1
3
Researchers mapped 540 million years of sea level change, showing major short-term shifts during ice ages driven by Earth's orbital cycles. #geography .
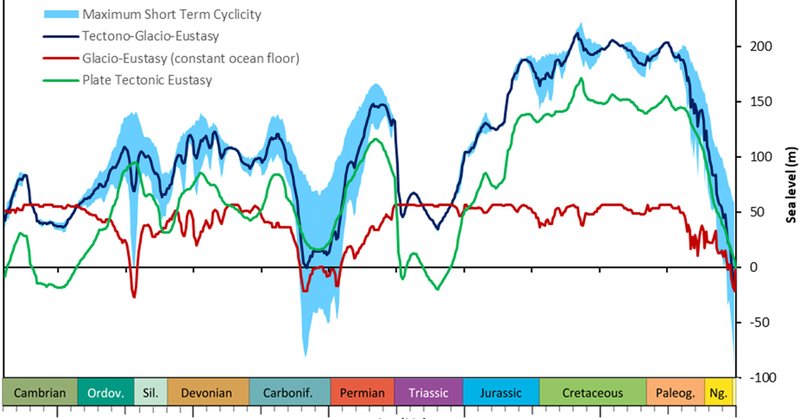
geographyrealm.com
Researchers mapped 540 million years of sea level change, showing major short-term shifts during ice ages driven by Earth's orbital cycles.
0
0
2
FAO’s global dataset maps access to towns and cities of all sizes within reasonable travel times, identifying patterns of urban interconnectedness. #GIS #geography .
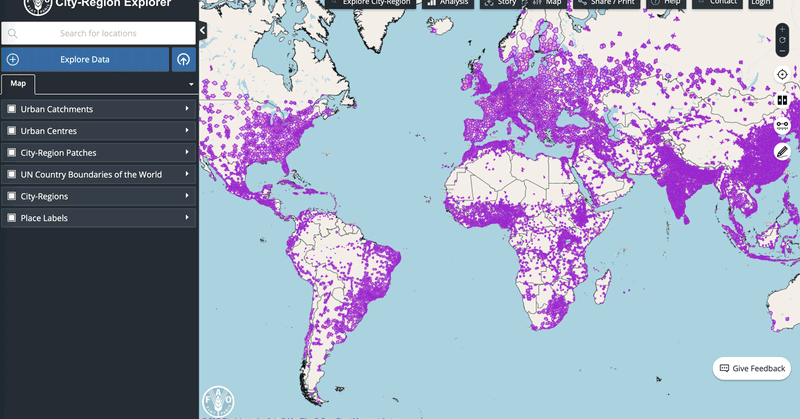
geographyrealm.com
FAO’s global dataset maps access to towns and cities of all sizes within reasonable travel times, identifying patterns of urban interconnectedness.
0
0
4
Explore the city-regions dataset from FAO .#GIS #geography .
geographyrealm.com
FAO’s global dataset maps access to towns and cities of all sizes within reasonable travel times, identifying patterns of urban interconnectedness.
0
1
3
Mapping short-term sea level changes over 540 Million years .#geography .
geographyrealm.com
Researchers mapped 540 million years of sea level change, showing major short-term shifts during ice ages driven by Earth's orbital cycles.
0
0
4
Since the 1960s, more and more crows have been abandoning their rural winter roosts in favor of cities and towns. #geography .
0
0
2
RT @USGS_EROS: ICYMI: The newest version of Annual NLCD is available. Adding 2024 extends the Landsat-based U.S. land cover record to 40 ye….
0
13
0
Alexandros Voukenas explains how to calculate land use mix indices (such as entropy) in a GIS environment. #GIS #geography .
0
2
14
Always great to see profiles of people working in the GIS field - check out this short video on mapping for an open space authority.
0
0
1
RT @giswqs: 🚀 GeoAI Tutorial 22: Batch Segmentation on Multiple Satellite Images — with Just One Line of Code 🌍🛰️. Want to run deep learnin….
0
14
0
Well into the 17th and 18th centuries, cartographers created maps of the region showing California separated from the mainland by a strait. #geography #maps .
0
0
1
Anindita Ghosh discusses her study that used GIS tools and analysis to map out areas with groundwater potential in a desert. #GIS #geospatial #geography .
0
0
2